Area
Good when you want to emphasis an amount of change over time. Each line represents a data series.
Displays the trend of values over time or over categories
The area below each line is filled in.
Series Options
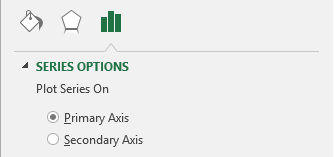 |
Plot series on primary axis -
Plot series on secondary axis -
Fill
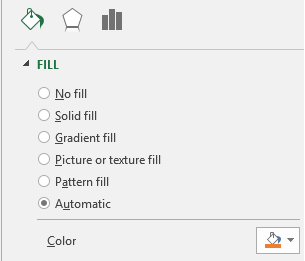 |
No fill - Makes the series transparent with no fill colour
Solid Fill - Color, Transparency
Gradient Fill - Preset gradients, Type, Direction, Angle, Gradient Stops, Color, Position, Transparency, Brightness, Rotate with shape.
Picture or texture fill - Insert picture from file, Insert picture from clipboard, Insert picture from online, Texture, Transparency, Tile picture as texture, Offset x, Offset y, Scale x, Scale y, Alignment, Mirror type, Rotate with shape.
Pattern fill - Pattern, Foreground, Background Automatic - Color
Automatic - Color
Border
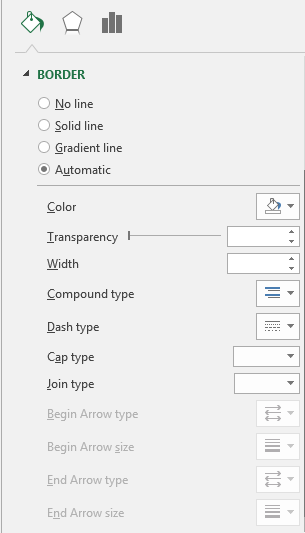 |
No line - No border line is displayed
Solid line - Color, Transparency, Width, Compound type, Dash type, Cap type, Join type. The four Arrow options are never enabled for column charts.
Gradient line - Preset gradients, Type, Direction, Angle, Gradient stops, Color, Position, Transparency, Brightness, Width, Compound type, Dash type, Cap type, Join type. The four Arrow options are never enabled for column charts.
Automatic - Color, Transparency, Width, Compound type, Dash type, Cap type, Join type
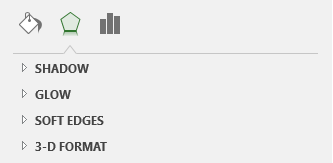
Effects
Refer to the Page - Chart Formatting > Effects
 |
In Excel 2007, the numerical value is not shown in the mouse over ?
© 2024 Better Solutions Limited. All Rights Reserved. © 2024 Better Solutions Limited TopPrevNext