Moving
If you have an embedded chart then you can easily move the chart to a different location on the worksheet.
There are two ways you can move an embedded chart:
1) By seleting the Chart Area and dragging.
2) By selecting the Chart Object and dragging.
Moving the Chart Area
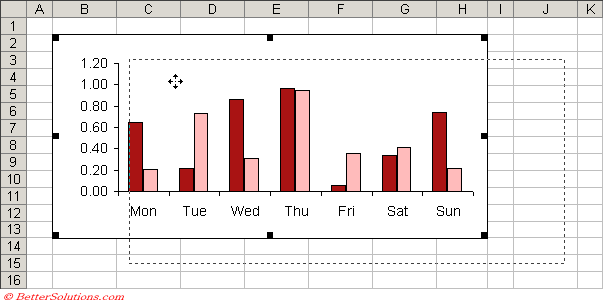
Select the chart area by clicking in the blank area near to one of the four corners.
Eight small black handles will appear inside the perimeter of the chart area when the chart area is selected.
 |
Select the chart border and drag the chart
To move the chart press the left button so the cursor changes to four arrows. While holding down the left mouse button drag the mouse until the chart is in the required position.
Once the outline is in the desired location, release the left mouse button to drop the chart at the new location.
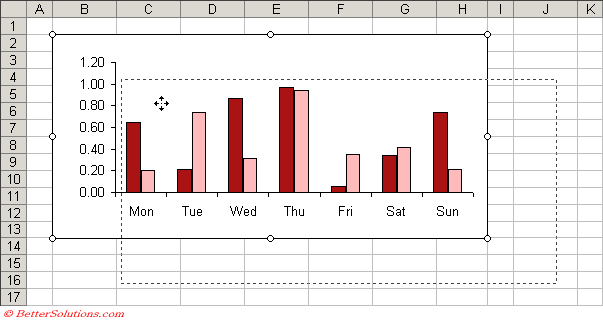
Moving the Chart Object
Hold down the mouse button and drag the chart to the desired position.
 |
You can also set the picture to "Don't move or size with Cells". Select the object, format object - then properties
Important
When dragging charts (or objects) on a worksheet, hold down the Alt key whilst dragging and the chart (or object) will snap to a cell, for easy aligning.
If you hold down the Shift key when dragging a chart it can be moved parallel to either the column or row headers.
If you hold down the Alt key when dragging a chart it will be aligned with the cell borders.
© 2024 Better Solutions Limited. All Rights Reserved. © 2024 Better Solutions Limited TopPrevNext