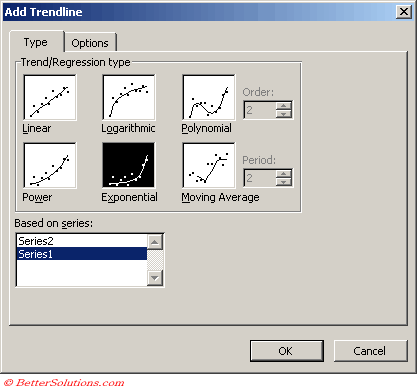
Exponential
Creates a curved line that shows data values that increase or fall at increasingly higher rates.
This trendline is not available if the data series contains any zero or negative numbers
This can only be used with positive values.
An exponential trendline is a curved line that is used when data values rise or fall at increasingly higher rates.
You cannot create an exponential trendline if your data contains zero or negative values.
y=cebx
where c and b are constants and e is the base of the natural logairthm
Note: The option is not available when your data includes negative or zero values
Equation: y = c *e ^(b * x)
c: =EXP(INDEX(LINEST(LN(y),x),1,2))
b: =INDEX(LINEST(LN(y),x),1)
Adding a Trendline
 |
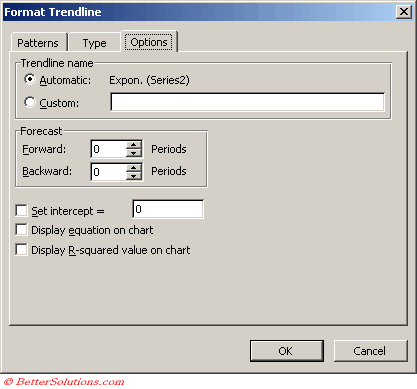
Trendline Options
 |
© 2024 Better Solutions Limited. All Rights Reserved. © 2024 Better Solutions Limited TopPrevNext