Linear
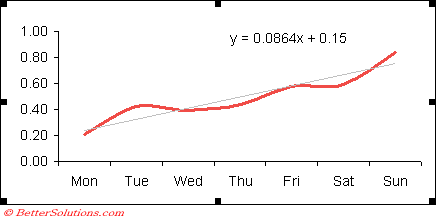
Creates a best fit straight line that shows how values in a data series increase or decrease at a steady rate.
A linear trendline is a best-fit straight line that is used with simple linear data sets.
Your data is linear if the pattern in its data points resembles a line.
A linear trendline usually shows that something is increasing or decreasing at a steady rate.
A trendline by using the following linear equation to calculate the least squares
y=mx + b
where m is the slope and b is the intercept
Equation: y = m * x + b
m: =SLOPE(y,x)
b: =INTERCEPT(y,x)
Correlation coefficient
r = CORREL(y,x)
R-squared = RSQ(y,x)
Adding a Trendline
Select (Chart > Add Trend Line).
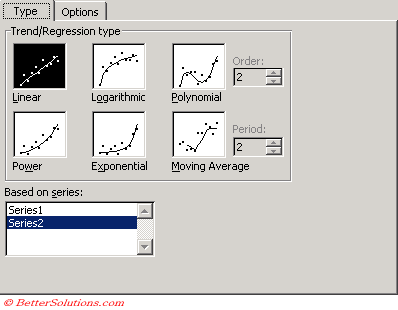 |
The Based on Series box lists all of the data series in the chart that support trendlines.
This lets you easily change the series which has the trendlines associated with it.
 |
Trend Line Options
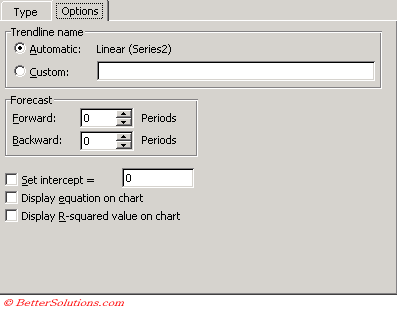 |
Trendline Name - This is the text that appears in the legend. If not specified it will default to the trendline type followed by the series name in parentheses
Forecast - Allows you to extend the trendline forward
Set Intercept - Allows you to specify the point on the value axis where the trendline crosses the axis
Display equation on chart - Displays the equation on the chart. You can overwrite this with different text but if you do it will remain static text
Display R-squared value on chart - Displays the R-squared value on the chart. You can overwrite this with different text but if you do it will remain static text
© 2024 Better Solutions Limited. All Rights Reserved. © 2024 Better Solutions Limited TopPrevNext