Formatting
Any changes you make to your pivot table will be saved as long as the "Preserve Formatting" option is checked on the Table Options dialog box.
The formatting will even be preserved when the column and row fields are changed.
It is possible to apply conditional formatting to your pivot tables although this is lost when the pivot table is refreshed.
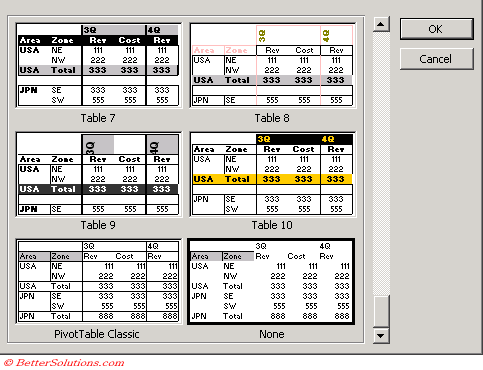
There are 21 autoformats available for your pivot tables.
These can be used by selecting (PivotTable > Format Report).
To remove an AutoFormat open the Format Report dialog box and select "none".
 |
AutoFormat (Format menu)
Applies a built-in combination of formats, called an autoformat, to a cell range or a PivotTable report. If a single cell is selected, Microsoft Excel automatically selects the range surrounded by blank cells and applies the autoformat to that range. If the selection is part of a PivotTable report, the entire table, except for the page fields, is selected and formatted. This command is not available if the sheet is protected.
Refreshing your pivot table will remove the formatting on your pivot chart in Excel 2000 - This is a known problem.
, to a PivotTable report, and selects indented format (the Report formats) or nonindented format (the Table formats). Changing between nonindented format and indented format might also change the layout of the report, so that column fields become row fields or vice versa.
To format a pivot table and to preserve the formatting you must select the entire table (PivotTable > Select > Entire Table) and select "Enable Selection".
This activates the structures selection and is needed for formatting or for refining calculated item formula. Once pressed format the table as desired.
Formatting Numbers
You can change the format of the numbers displayed in the Data Area (just ?)
Select any cell and select (PivotTable > Field Settings).
Select the Number button
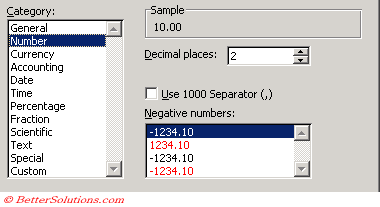 |
This is identical the Number tab displayed in the (Format > Cells) dialog box.
You can change the number format.
Pivot Table Style
PivotTable Styles have the same design goals as Table Styles, and they also have the same user model and customization story.
The only real difference between the PivotTable and Table Styles is with regards to the number of elements in a PivotTable style.
Whereas Table Styles have 13 elements (headers, row banding, total rows, etc.), PivotTable styles have 25 elements.
The additional elements are due to the fact that PivotTables are more complex than tables, so there are more table elements available for users to define formatting on.
For example, you can define formatting for multiple levels of data, there are multiple levels of subtotals possible in a
PivotTable, etc.
Excel 12 will come with a large set of predefined PivotTable styles that you can pick and choose from.
In addition, just like table styles, you can create your own styles that fit your specific needs whether that might be corporate guidelines or individual preferences.
PivotTables, however, are more complex than tables, so there are more table elements available for users to define formatting on.
For example, you can define formatting for multiple levels of subtotals, you can define striping at different levels in the PivotTable.
Important
The formatting of numbers is only applicable to the data area and is not available for row, column or page fields.
© 2024 Better Solutions Limited. All Rights Reserved. © 2024 Better Solutions Limited TopPrevNext