3D Charts
It is possible to create 3D charts in Excel.
Not all 3D charts have to actually have a third dimension (and have a third axis).
3D charts will often have three axes corresponding to the height, width and depth of the chart.
Wall and Floor
These are only applicable to 3D charts.
The wall can be formatted separately from the plot area.
The floor can be formatted separately from the plot area.
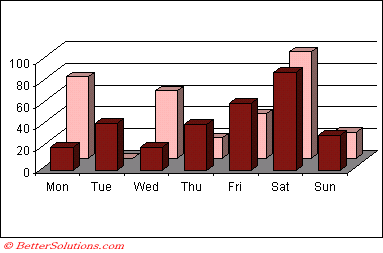
3D Bar Chart
 |
You can also select (Chart > 3D View) to display the 3D view dialog box.
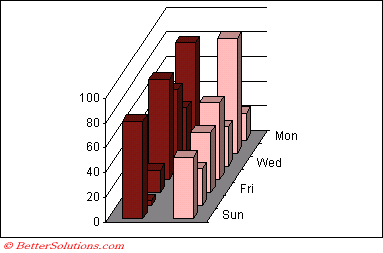
You can change the rotation of the charts as well as the elevation and perspective
Rotating Charts
When a 3D chart is active you can select (Chart > 3D View) to display the 3D View dialog box
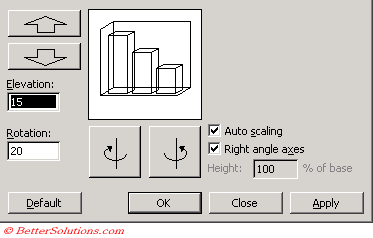 | (View > 3D View) dialog box |
The sample chart displayed in the dialog box shows the result of the current settings.
 |
Important
Excel does not support 3D combination charts.
The maxiumum number of data points on a 3D chart is 4,000.
2007 Changes
CHART TYPES - 3D
Gridlines on 3D charts have been removed
If a 3D chart is ungrouped the entire plot area continies to exist as a single group
2D walls have been removed ?
Cylinder and cone 3D charts with borders look different
In previous version there was a silouette of cylinders and cones
3D charts - pattern filles are now drawn on the surface of the 3D charts
They were previously not always drawn on the surface.
The angle of the surface to the screen was not taken into account.
3D charts may look slightly different
shading, lighting and colours are different
3D stacked or 100% stacked area that might have negative values look different in 2007
In earlier versions the mouse could be used to directly manipulate the 3D view of a chart. In Excel 2007 you must use the 3D Rotation dialog box.
© 2026 Better Solutions Limited. All Rights Reserved. © 2026 Better Solutions Limited TopPrevNext