Logarithmic
Creates a best-fit curved line that illustrates how data values increase or decrease and then level out.
You can use both negative and positive values.
A logarithmic trendline is a best-fit curved line that is used when the rate of change in the data increases or decreases quickly and then levels out.
A logarithmic trendline can use both negative and positive values.
A logarithmic trendline by using the following equation to calculate the least squares fit through points
y=c ln x + b
where c and b are constants and ln is the natural logarithm function
Equation: y = (c * LN(x)) - b
c: =INDEX(LINEST(y,LN(x)),1)
b: =INDEX(LINEST(y,LN(x)),1,2)
Adding a Trendline
Select (Chart > Add Trend Line).
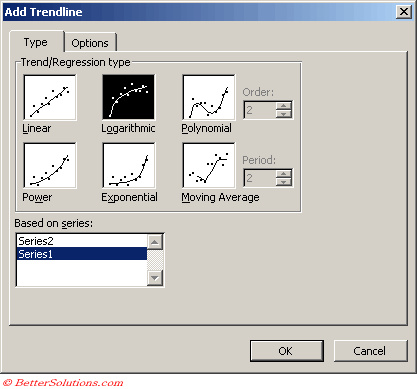 |
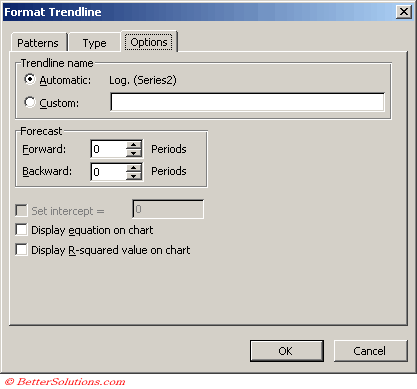
Trendline Options
 |
© 2026 Better Solutions Limited. All Rights Reserved. © 2026 Better Solutions Limited TopPrevNext