Chart Tab
Replaced in 2007
Active Chart
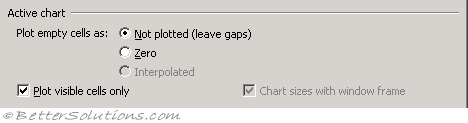 |
You will only be able to change these settings if you currently have a chart active.
Plot empty cells as - There are three choices: "Not Plotted" which ignores any blank cells and leaves gaps in the line: "Zero" which means blank cells are treated as zero, so the line drops to the zero-scale: "Interpolated" which means that any blank cells will have a connecting line meaning there are no gaps. (Select Data Source, Hidden and Empty Cells).
Plot visible cells only - If ticked will only plot visible cells and any hidden cells will not be plotted. (Select Data Source, Hidden and Empty Cells).
Chart sizes with window frame - (Removed in 2007). This is only appropriate for charts on separate chart sheets, not for embedded charts. This will ensure the chart always fills the window.
Chart Tips
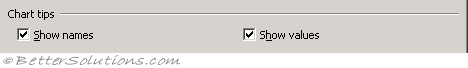 |
Show names - Displays the item of the chart when you hover over it. (Advanced tab, Display - show chart element names on hover)
Show values - Displays the value of a data marker when you hover over it. (Advanced tab, Display - show data point values on hover)
© 2025 Better Solutions Limited. All Rights Reserved. © 2025 Better Solutions Limited TopPrevNext