from Yield Curve
You can create a spot curve by using the Treasury Yield Curve
A spot curve created in this way is called the Treasury Spot Curve or Spot Rate Treasury Curve.
This curve shows the yield to maturity of zero-coupon treasury securities.
Constructing the Curve using Coupon Paying Bonds
How do we construct the zero-coupon yield curve from coupon paying bonds.
We can do this using a process called Bootstrapping
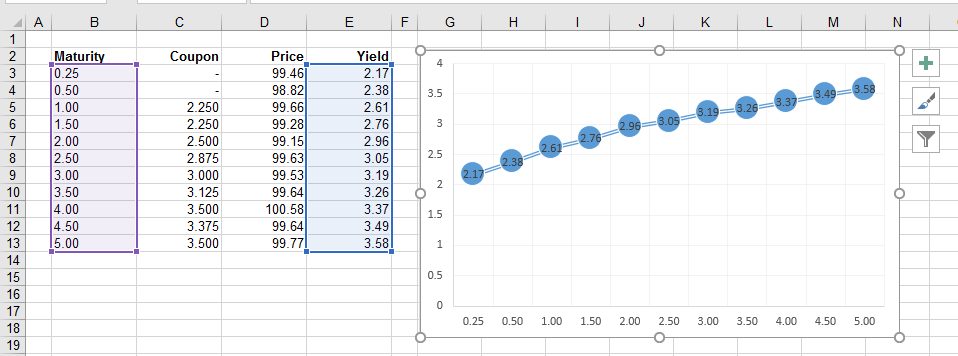
Lets suppose that we have the following US Treasury Bills and Notes
The chart shows these yields plotted against their maturity dates.
 |
1 Year Spot Rate
We already know the 0.25 and 0.5 spot rates since these Treasury Bills are already zero-coupon bonds.
So lets calculate what the 1 year spot rate would be.
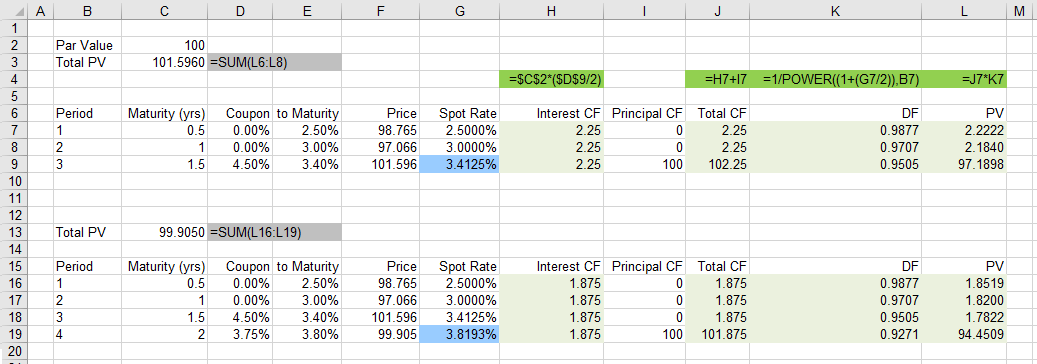
We can calculate this using a method called bootstrapping.
1.5 Year Spot Rate
 |
© 2025 Better Solutions Limited. All Rights Reserved. © 2025 Better Solutions Limited TopPrevNext