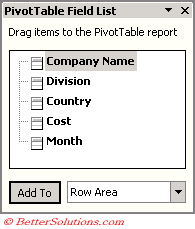
PivotTable Field List Task Pane
The PivotChart contains the same data as the PivotTable but just represented in a chart
SS
Report Filter
Add a field to filter the entire report based on entries in this field
Column Labels / Legend Fields
add a field to display entries as column titles along the top
this changes to legend fields (series) when a pivotchart is active
Row Labels / Axis Fields
add a field to display entries as row labels on the left hand side
This changes to axis fields (categories) when a pivotchart is active
Values
add a field to display summary data and totals
Choose Fields to Add
add fields containing numbers to the Values area and fields containing text to the Row labels or axis fields (categories)
you can drag these fields to the boxes below or right mouse click to see a shortcut menu
SS - shortcut menu
Layout Boxes
You can move the indiviidual fields up or down and access other field settings by clicking on a specific field
SS
Move Up
Move Down
Move to Beginning
Move to End
Move to Report Filter
Move to Row Labels
Move to Column Labels
Move to Values
Remove Field
Field Settings
Using the PivotTable Field List Pane
This is new to Excel 2002 and can easily be closed if you find it annoying.
To populate the pivot table drag the field headings from the field list pane onto your pivot table.
 |
It can be redisplayed by selecting the Show Field List button on the PivotTable toolbar.
When you move a field, the filter selections remain the same for the field
When you move or add fields, a thick border identifies the new location of the field before it is dropped.
You can remove a field from a pivot table by clicking it and dragging it back to the Pivot Table Field List.
As you drag a field the cursor will change to indicate the action. A red cross indicates that the field will be removed.
You can also use the Field options
To remove a field, drag the heading off the layout
© 2026 Better Solutions Limited. All Rights Reserved. © 2026 Better Solutions Limited TopPrevNext