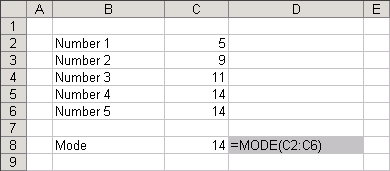
Mode
This average can be defined as the most frequently occurring value in a distribution.
The mode can be used with Nominal Data, Ordinal Data, Interval Data and Ratio Data.
Not widely used.
If you plot a frequency distribution chart then the mode is the item with the highest frequency.
 |
For more examples of this function please refer to the MODE page.
Calculating the mode average for a grouped frequency distribution is not that useful since you have not got the individual values. In these situations the group mode is normally sufficient.
Most often:
● if two or more values occur the same number of times then there will be more than one mode value
If a set of values has two modes then this is called bimodal.
This value can swing widely and is very unstable
When people refer to the "normal" value they are referring to the "Mode" average.
© 2026 Better Solutions Limited. All Rights Reserved. © 2026 Better Solutions Limited TopPrevNext