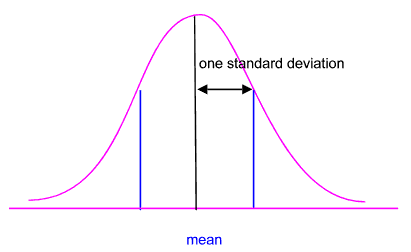
Normal Distribution
This is a continuous distribution.
Also known as a Gaussian Distribution, bell-shaped curve or bell curve.
A normal distribution is symmetrical at the mean and the two tails never touch the horizontal axis.
This goes from -infinity to +infinity
A normal distribution can be defined by two numbers: the mean and the standard deviation.
The mean determines its height
The standard deviation determines the width
Standard Deviation Cut-Offs
Standard Deviations cut off fixed propertions of the normal distribution from the mean to infinity in both directions.
approx 68 of the observation lie within 1 standard deviations of the mean
approx 95 of the observation lie within 2 standard deviations of the mean
approx 99.5% of the distribution lies within 3 standard deviations of the mean.
 |
Different Shapes
Normal distributions can be very tall or very flat.
The exact shape and size will depend on the mean and the standard deviation.
Analysis is often done with normal distributions to determine probabilities
http://www.statsoft.com/textbook/sttable.html
Cumulative Distribution Graph
SS
Excel Functions
NORM.DIST - Returns the probability of getting 'less than' or 'equal to' a particular random variable.
NORM.INV - Returns the random variable where the probability of getting 'less than' it is equal to P.
Z.TEST -
NORM.DIST(x, mean, standard_dev, cumulative)
If you want to know the probability that a variable with a normal distribution falls in the range of 'a' to 'b' use:
NORMDIST(b,mean,stdev,true) - NORMDIST(a,mean,stdev,true)
NORM.INV(probability, mean, standard_dev)
sometimes referred to as the Inverse Gaussian Density ??
An individual value from a non standard normal distribution is referred to as x
An individual value from a standard normal distribution is referred to as z.
Example - what score will be cut off for 15%
NORMINV(0.85,0,1)
Tails of a normal distribution are asymptotic, indefinitely decreasing but never touching the axis.
The normal distribution is important in inferential statistics because certain theoretical distributions are very close to being a normal distribution.
Histogram
Continuous data is obtained by measurement and the results are often displayed on a histogram
Checking for Normality
There are a number of ways you can check for normality
1) Histogram and compare the shape
2) Normal Probability Plot
3) Chi-Squared goodness of Fit
4) Anova, Skew and Kutosis test
4) Kolmogorov Smirnov test
5) Anderson Darling test
6) Shapiro Wilk test
Important
Is symmetrical around the mean, median and mode
Not all distributions are normal
It is possible to check that you have a normal distribution by using a version of the Chi-Square test to check.
© 2025 Better Solutions Limited. All Rights Reserved. © 2025 Better Solutions Limited TopPrevNext