Axes
Category X Axis - This is a line along which labels for the chart's categories are arranged. Categories are individual measurements intervals or groupings for the original data. In column charts, the category axis is the horizontal line along the bottom.
Value Y Axis - This is vertical for column charts.
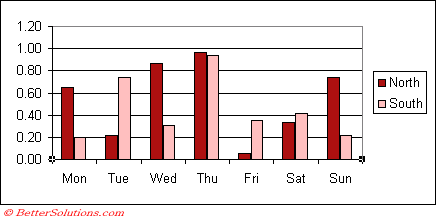 |
The X axis or category axis is always the horizontal axis along the bottom of your chart
 |
The Y axis or value axis is always the vertical axis which is usually on the left of your chart.
© 2026 Better Solutions Limited. All Rights Reserved. © 2026 Better Solutions Limited TopPrevNext