Chart Location
You can keep your charts within the worksheet itself (embedded) or on a special standalone worksheet (called a chart sheet).
Embedded Chart - This will create the chart as an embedded object in the drawing layer of the worksheet.
Chart Sheet - This will create a chart on an additional sheet within the workbook.
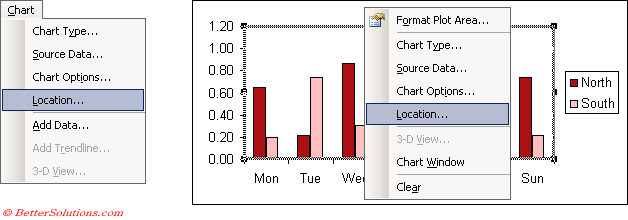
You can easily switch between the two possible locations by selecting (Chart > Location).
An alternative to using the Chart drop-down menu you could also use the Chart shortcut menu.
 |
This will display the Chart Location dialog box.
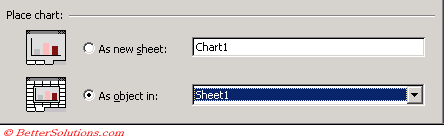 |
As new sheet - Inserts a new chart sheet before the active sheet.
As object in - This drop-down list includes all the worksheets and chart sheets in the active workbook. The chart sheet will be removed and the chart is moved to the selected worksheet.
If you choose to place your chart on a chart sheet you can enter the name of the chart sheet directly into the text box as opposed to renaming the sheet afterwards.
The location of a chart can be changed at any time by selecting (Chart > Location). This dialog box is identical to the last step of the Chart Wizard.
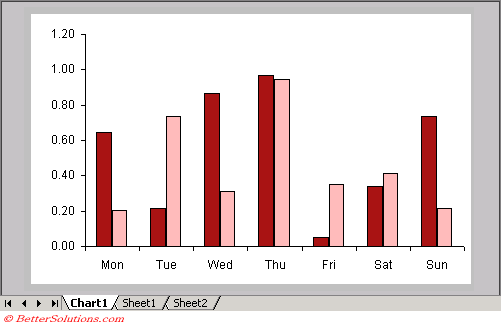
Embedded Charts
An embedded chart is placed in the worksheet's drawing layer and can often be treated like an object.
SS Include data in the screen shot
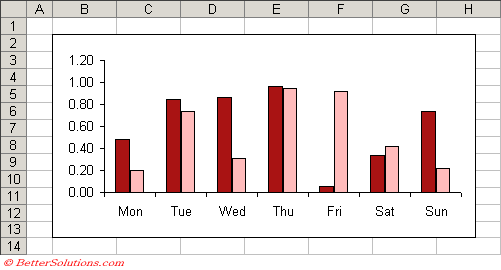 |
After you have created an embedded chart you can easily move it to a more suitable position on your worksheet.
These type of charts allow you to display the chart next to the data that is used.
Using embedded charts also lets you print the data next to the actual chart.
As with any other type of drawing object, embedded charts can be moved and resized on the worksheet.
It is also easier to see how the chart changes when the data changes.
Chart Sheets
It is possible to display several charts on a single chart sheet. Create your charts on a worksheet as usual.
These occupy an entire sheet and do not contain the data. This is the default.
This can be useful if you want to display the chart and the data separately.
When you choose (Chart > Location) you can use the drop-down list to move them to an existing chart sheet. Once the charts are there you can rearrange and size them ??
A chart sheet normally holds a single chart and is an optional way to display your charts. They make it slightly easier to work with and printing a chart on a page a bit easier, useful for presentations.
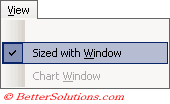
It is possible to resize a chart automatically according to the size of the window. Select (View > Sized with Window).
When this option is enabled the chart will resize automatically to fit the current window.
When a chart is created on a chart sheet the chart takes up the whole sheet.
You can adjust the size of a chart in a chart sheet by using the (View > Sized with Window).
 |
You can then adjust the size by adjusting the size of the window.
If the chart does not fit into the window then scroll bars will appear automatically.
 |
To add controls (combo boxes, command buttons etc) to a chart sheet, use the Forms toolbar and not the Controls toolbar).
It is possible for a chart sheet to contain more than one chart. You can move an embedded chart to an existing chart sheet.
You can delete a chart sheet exactly the same as you would delete a normal worksheet.
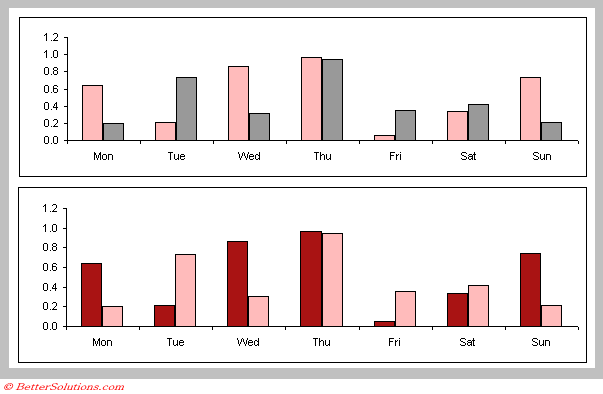
Multiple Charts on Chart Sheets
It is possible to have multiple charts displayed on a single chart sheet.
Activate the embedded chart you want to move and select (Chart > Location)
When you specify the "as new sheet" option you can type the name of an existing chart sheet.
Pressing OK will display a confirmation dialog box. Press OK
This new chart can then be repositioned and resized accordingly.
 |
Important
Using chart sheets can often make it easier to find a particular chart as each chart sheet can be given a descriptive name.
If you have put multiple charts on the same chart sheet you can only modify one at a time.
© 2025 Better Solutions Limited. All Rights Reserved. © 2025 Better Solutions Limited TopPrevNext