Grouping
Grouping is also commonly referred to as Outlines.
Outlines allow you to organise and your data as well as letting you temporarily hide data you do not want to see.
They allow you to collapse or expand levels of details quickly aloowing you to create a hierarchy of rows and columns.
Outlines are a way of easily hiding and displaying single blocks of rows and columns.
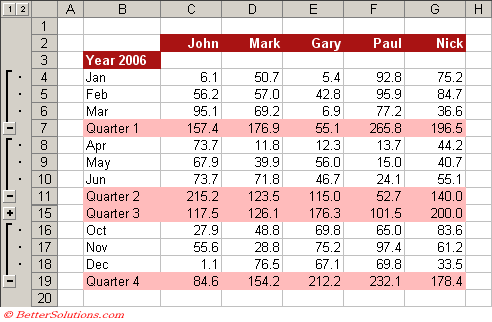
You can expand and collapse the individual months for each quarter by using the plus and minus buttons on the left hand side..
 |
You can have up to a maximum of 8 outline levels for both rows and columns.
An Outline can be created manually or automatically.
Manual - You identify each group of related data.
Automatic - This is typically used when you have a table that contains totals and subtotals.
Outline Level Bar
The Outline level bar is the grey bar on the left hand side of the cells.
This bar will be automatically displayed when you Group any rows or columns on a worksheet.
To hide the Outline level bar select (Tools > Options)(View tab, "Outline symbols").
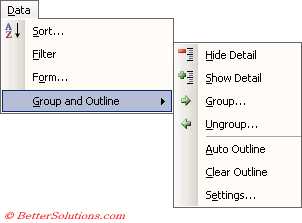
(Data > Group and Outline) sub menu
 |
Hide Detail - Allows you to collapse the rows (or columns) for a particular outline.
Show Detail - Allows you to expand the rows (or columns) for a particular outline.
Group - Allows you to highlight a group of rows and columns and to add a manual outline.
UnGroup - Allows you to highlight a groups of rows and columns and remove the outline.
Auto Outline - Creates an automatic Outlines table from the current selection.
Clear Outline - Removes the Outlines from a table.
Settings - Displays the Settings dialog box displayed below.
Creating Manual Outlines
Select the rows (or columns) you want to group and select (Data > Group and Outline > Group).
To remove an outline, make a selection that includes the appropriate rows and columns.
It is possible to apply these styles in a similar way to ??
Creating Automatic Outlines
You can select any cell in the table if you do not want the whole table then highlight the specific area first.
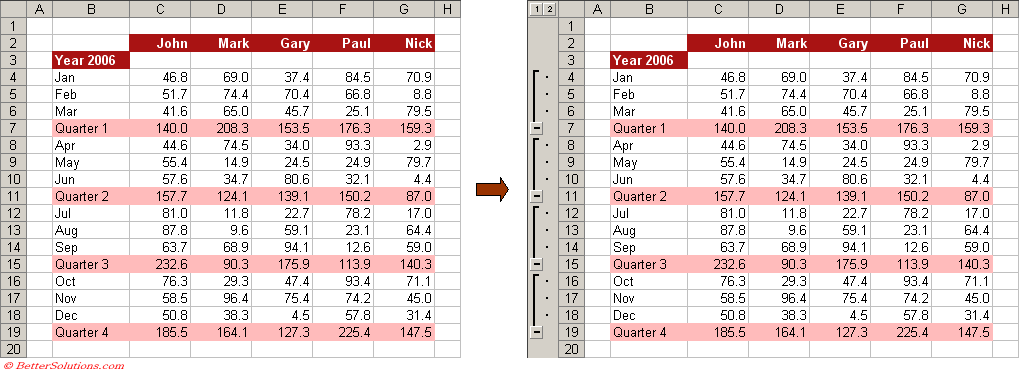
To transfer a table of data into an Outlined table select (Data > Group and Outline > Auto Outline).
 |
Excel will automatically include both horizontal and vertical outlines in a table that is setup as a Database.
Excel analyses the formulas in the cells to determine the outline hierarchy
Assuming that the cell references in the formulas must point in a consistent direction, with summary rows placed consistently above or below their related detail data.
Summary rows (which contain totals) must be below the list data.
Summary columns must be to the right.
Settings Dialog Box
Select (Data > Group and Outline > Settings) to display the Settings dialog box.
 |
Summary rows below detail -
Summary columns to right of detail -
Automatic Styles - There are many pre-defined styles for the various outlines.
Apply Styles -
Create -
Automatic Styles
You can create automatic formatting for your outline to help you quickly identify the different outline levels.
To apply special formatting you must first create format Styles for all the levels you want formatted.
You must create your styles with the following names:
| RowLevel_1 | Defines the formatting for the first row in your outline. |
| RowLevel_2 | Defines the formatting for the second row level in your outline. |
| RowLevel_X | Defines the formatting for a row of level number X in your outline. |
| ColLevel_1 | Defines the formatting for the first column level in your outline |
| ColLevel_2 | Defines the formatting for the first column level in your outline |
| ColLevel_X | Defines the formatting for a column of level number X in your outline. |
Important
You can have up to 8 outline levels.
(Ctrl + Shift + " _ ") - Removes an outline border from the selection.
(Alt + Shift + Right Arrow) - Displays the (Data > Group and Outline > Group) dialog box.
(Alt + Shift + Left Arrow) - Displays the (Data > Group and Outline > UnGroup) dialog box.
You cannot undo any of the Outline actions using (Edit > Undo).
© 2026 Better Solutions Limited. All Rights Reserved. © 2026 Better Solutions Limited TopPrevNext