Subtotals
Subtotals are a way of providing additional aggregate information within a table of data.
They provide a way to quickly add up the values in each field and is much quicker that trying to use the SUM function.
Automatic subtotal formulas can be added to a table that is setup as a database.
You can use Excel's automatic subtotals to quickly summarise the data in your database.
This feature can be used to calculate both subtotals as well as grand totals and can be accessed from the Data Tab.
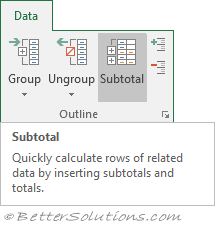 |
This allows you to quickly insert the SUBTOTAL worksheet function combined with Outlines to help you summarise your information.
AGGREGATE was added in Excel 2010 to replace this function.
Preparing your Data
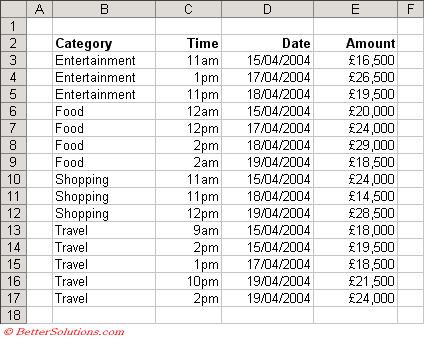
Before you can add subtotals to your data you must check that all the rows you want to subtotal are next to each other.
The quickest way to do this is probably by sorting the data.
Our data contains our food categories in the first column so our table will be grouped by cetegory.
Excel monitors the values in the first column and every time this value changes a subtotal is inserted.
 |
One Way Operation
Using Automatic subtotal button is a one way operation.
To remove this you need to ungroup all the rows and remove the subtotals manually.
Adding Subtotals
If you want to add subtotals in the middle of your table then select a single cell in your table before selecting (Data > Subtotals).
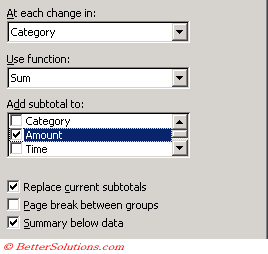 |
At each change in - Allows you to choose the column or field which you would like to subtotal. This list corresponds to the column labels at the top of your table.
Use function - Allows you to select the type of function you want to use for the subtotals:
| SUM | The total value of the numbers in a list or cell range. |
| COUNT | The number of numeric values in a list or array of numbers. |
| COUNTA | Count Nums The number of non blank cells in a list or cell range. |
| AVERAGE | The arithmetic mean of a list or array of numbers. |
| MAX | The largest value in a list or array of numbers. |
| MIN | The smallest value in a list or array of numbers. |
| PRODUCT | The product of all the numbers in a list or cell range. |
| STDEV | The standard deviation based on a sample. |
| STDEVP | The standard deviation based on an entire population. |
| VAR | The compound variance based on a sample. |
| VARP | The variance based on an entire population. |
Add subtotal to - Identifies the columns in which the subtotals will appear.
Replace current subtotals - Removes any existing subtotals in the list before applying the new subtotals.
Page break between groups - Inserts page breaks automatically after each group of subtotalled data.
Summary below data - Inserts the subtotal and grand total rows below the detail data.
SS
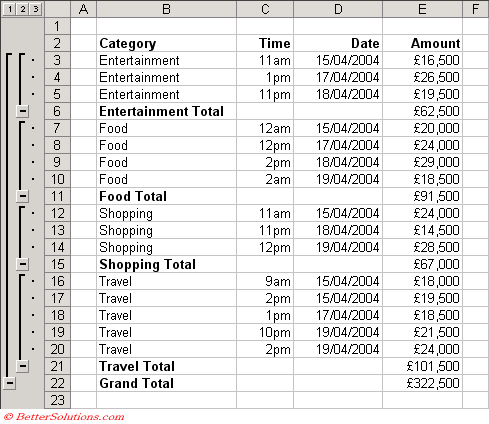
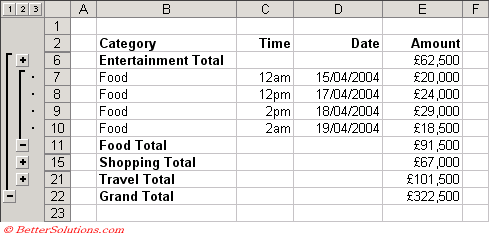
Example of a single subtotals 1 level
 |
 |
Removing Subtotals
If you want to remove all the subtotal from a table select (Data > Subtotals) and select the Remove All button.
To remove all of them select the "remove all" checkbox
Copy only Visible Cells
When you've filtered data or hidden rows or columns, selecting a block of cells will also select the cells that are hidden as well.
There is a hidden command that will let you select only the visible cells.
It's hidden in that you have to add this command to your toolbar in order to use it.
Right-click in the gray area of the toolbar to the right of Help
Choose Customize
SS
Go to the Commands tab
Choose the Edit category
Scroll all the way to the bottom of the list of Edit Commands
You should find the Select Visible Cells command
Click and drag this command and drop it where you want it to appear on a toolbar.
Now anytime you have cells hidden, you can click the Select Visible Cells icon to select all the currently visible cells WITHOUT selecting those cells you can't see.
This feature actually inserts SUBTOTAL functions into each of the summary rows.
Important
You can have several layers of subtotals or subtotals for smaller groups within your original subtotal groups.
You can also use the Subtotals feature to calculate the average, minimum or maximum values in each category.
An alternative to using Subtotals is to use Pivot Tables.
A pivot table might be more appropriate if you have a lot of data and you want more flexibility with the formulas.
© 2026 Better Solutions Limited. All Rights Reserved. © 2026 Better Solutions Limited TopPrevNext