Frequency Distribution Table
This is often the starting point for most statistical investigations.
For nominal variables the order of the categories is irrelevant
For all other variables the categories should be listed in increasing rank order.
By counting frequencies you can construct a frequency table
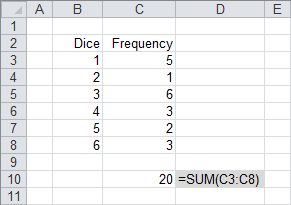
Lets suppose we throw a dice 20 times and write down the number that is on the top.
{4,2,1,6,3,4,3,3,5,1,3,4,1,6,5,1,3,6,1,3}
We can construct a frequency table to show the results of this experiment.
 |
These can often be described using a probability distribution table.
A table could be used because discrete variables can only take on certain values.
The probability distribution of a discrete random variable can be represented in tabular form as a list of probabilities associated with each possible value.
Grouped Frequency Distribution
When you have a large amount of data you might want to group the data into categories (or intervals).
Continuous data can by definition take on any value.
To overcome this problem you use a grouped frequency table
In this case intervals are defined into which the data can be grouped
© 2025 Better Solutions Limited. All Rights Reserved. © 2025 Better Solutions Limited TopPrevNext