Changing
There are five ways you can change the source data of a chart.
1) Overwriting the cells with different values.
2) Using the Select Data dialog box.
3) Using the Range Indicator.
4) Editing the Series Formula.
5) Dragging individual Data Points.
Overwriting the Cells
When a chart is created the source data is linked to the chart object meaning that any changes to the data are reflected on the chart automatically.
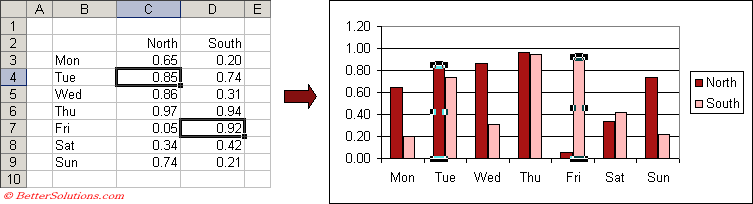
Lets change the values in cells "C4" and "D7" to 0.85 and 0.92 respectively.
 |
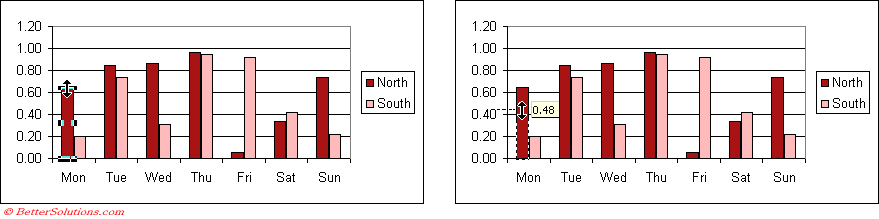
Dragging individual Data Points
You can also drag the chart data point to change the value on the worksheet.
 |
Adding Source Data / Series
The series tab - You can use the Add button to create a new series and the Remove button to remove any
You can modify these ranges either by editing the range directly or by dragging the automatic range finders
The Source data dialog will change slightly if a bubble chart is activate
SS
All the data for a specific series must be on the same worksheet. It does not have to be in a contiguous range. You can use data from different worksheets on the same chart by using different series. Step 2, Series tab ot the Chart Wiward.
A bubble chart requires an additional set of data to define the size of the bubbles.
Adding a Series
Select the cells containing the new data series (Edit > Copy). Click the chart and select (Edit > Paste). It will either be added immediately or the Paste Special dialog box will be displayed.
Removing a Series
You can easily remove a data series from a chart by selecting it and pressing Delete.
You can alternatively select (Edit > Clear > Series).
A surface chart does not let you select a specific series ??
Adding More Data
After you have created a chart you can very easily add another data series to it. Select the cells containing the new data series, copy the data, select the chart and paste the data.
There are several ways you can add an additional series to an existing chart.
1) Select the chart area and drag the colour range markers to include the additional cells.
2) Select the new cells and copy them to the clipboard. Select the chart and paste the data on top of it.
3) Select the new cells and drag them on to the chart.
If you need to plot data that is on more than one worksheet, you can add another series once the chart has been created.
Select the area of the new data series. (Edit > Copy). Click on the chart and (Edit :> Paste) . It will either add it straight away or it will display the Paste special dialog box
When you select the chart area it should highlight the source data automatically (colour coding) You can drag the corners to add more data. You can extend the source data, but then hide the rows. This means that the data points are not actually plotted.
To delete a series just select the series and hit delete
Avoid copying the charts as objects (white handles) and always copy them as chart objects (black handles).
If you have data with years in one column then Excel will treat this column as a data series and not as the category-axis labels
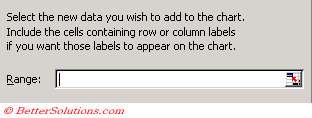
(Chart > Add Data) dialog box
 |
If you want to plot data from different worksheets this must be done using Step 2 of the chart wizard.
You should create your chart initially using just one series of data. The additional series can the be added afterwards.
© 2026 Better Solutions Limited. All Rights Reserved. © 2026 Better Solutions Limited TopPrevNext