Dynamic Data Source
Source Data Expands Automatically
If you have a data series that you add data to on a regular basis then you can easily expand the data source automatically to include the additional rows.
This method uses a combination of named ranges and worksheet functions.
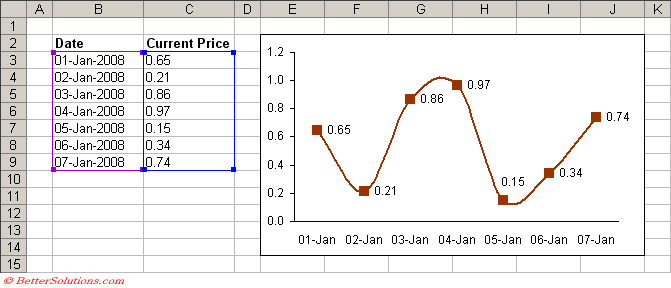
In this example we want to include all the data below the headings in row 2 and for any additional data to be automatically included.
Lets use the following table of data and lets create a simple line chart.
 |
Creating the Named Ranges
The named range that we need to use will have to be a Dynamic Named Range. These will change automatically.
We are going to use two worksheet functions in this named range:
The COUNTA function returns the number of non blank cells in a cell range.
This function is used to return the corresponding number of rows for the data series.
The OFFSET function is used to return the cell range which contains all the data.
Select (Insert > Name > Define) and type the name "ChartDates" in the Names in Workbook textbox.
Enter the following into the Refers To box:
=OFFSET(Sheet1!$B$3,0,0,COUNTA(Sheet1!$B$3:$B$100),1)
You do need to include the dollar signs $ otherwise the correct formula will not be used.
Select (Insert > Name > Define) and type the name "ChartNumbers" in the Names in Workbook textbox.
Enter the following into the Refers To box:
=OFFSET(Sheet1!$C$3,0,0,COUNTA(Sheet1!$C$3:$C$100),1)
Changing the Source Data
Once these two named ranges have been created you can use these for your source data instead of the actual cell ranges.
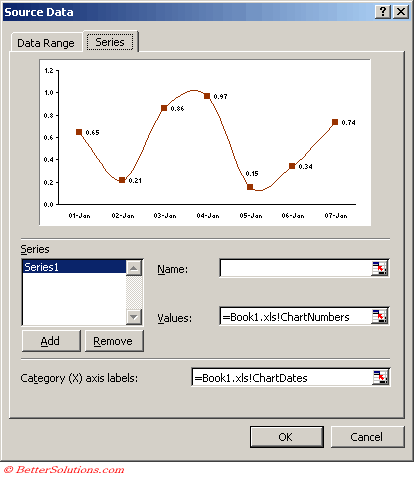
Highlight the chart, right mouse click, select Source Data and select the Series tab.
Highlight and replace the Values cell range $C$3:$C$9 with the text "=Book1.xls!ChartNumbers"
Highlight and replace the Category cell range $B$3:$B$9 with the text "=Book1.xls!ChartDates"
Any extra data you know add to your table will be automatically includes on your chart.
 |
Important
Be sure to include the worksheet name and there cannot be any blank rows. Do not try and type the form
For some bizarre reason you cannot use the named range "ChartValues" ?
© 2026 Better Solutions Limited. All Rights Reserved. © 2026 Better Solutions Limited TopPrevNext