Moving Average
Reduces the fluctuations in the trend line to a show smoother pattern.
This trendline is not available if the data series contains any zero or negative numbers
You use the period field to specify the number of data values to create the line.
Excel creates the line by averaging the specific data values.
For example if the period value is 2, the first two values are averaged, that value is the first point on the line, and then the second and third values are averaged and that becomes the second point.
A moving average trendline smoothes out fluctuations in data to show a pattern or trend more clearly.
A moving average uses a specific number of data points (set by the Period option), averages them, and uses the average value as a point in the line.
If Period is set to 2, for example, then the average of the first two data points is used as the first point in the moving average trendline.
The average of the second and third data points is used as the second point in the trendline, and so on.
A moving average trendline by using the following equation
Ft = (At + At-1 + At-2 + ) / n
Note the number of points in a moving average trendline equals the total number of points in the series less the number that you specify for the period.
Adding a Trendline
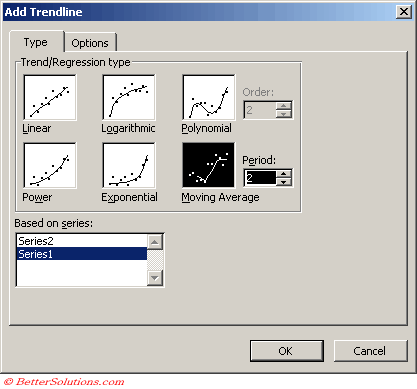 |
Type the number of periods to be used to calculate the moving average in the Period box.
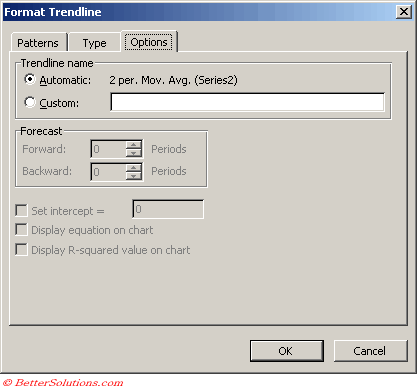
Trendline Options
 |
Important
If you add a moving average to a scatter chart the moving average is based on the order of the x-values plotted in the chart. To get the result that you want you might need to be sort the x-values before adding the trendline.
© 2026 Better Solutions Limited. All Rights Reserved. © 2026 Better Solutions Limited TopPrevNext