Polynomial
Creates a curved line illustrating fluctuations in the data values.
This trendline has an additional parameter
You can specify an order value to indicate the maximum number of fluctuations or bends that occur on the line.
A polynomial trendline is a curved line that is used when data fluctuates.
It is useful, for example, for analyzing gains and losses over a large data set.
The order of the polynomial can be determined by the number of fluctuations in the data or by how many bends (hills and valleys) appear in the curve.
An Order 2 polynomial trendline generally has only one hill or valley.
Order 3 generally has one or two hills or valleys. Order 4 generally has up to three.
A polynomial or curvilinear trendline by using the following equation to calculate the least squares fit through points:
y=b + c1x + c2x2 + c3x3 +
where c1, c2, c3, are constants
2nd Order Polynomial Trendline
Equation: y = (c2 * x^2) + (c1 * x ^1) + b
c2: =INDEX(LINEST(y,x^{1,2}),1)
C1: =INDEX(LINEST(y,x^{1,2}),1,2)
b = =INDEX(LINEST(y,x^{1,2}),1,3)
3rd Order Polynomial Trendline
Equation: y = (c3 * x^3) + (c2 * x^2) + (c1 * x^1) + b
c3: =INDEX(LINEST(y,x^{1,2,3}),1)
c2: =INDEX(LINEST(y,x^{1,2,3}),1,2)
C1: =INDEX(LINEST(y,x^{1,2,3}),1,3)
b: =INDEX(LINEST(y,x^{1,2,3}),1,4)
Notice the pattern in the two preceding sets of formulas
Adding a Trendline
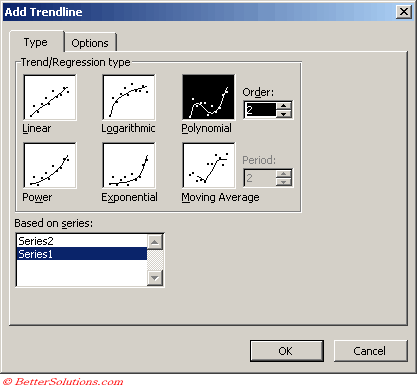 |
Type the highest power for the independent variable in the Order box
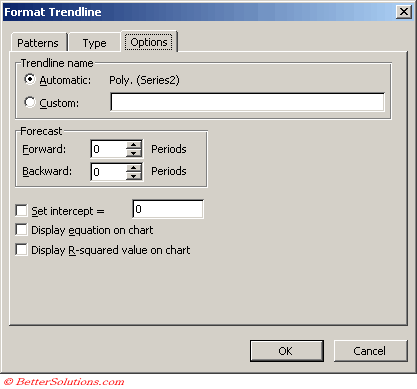
Trendline Options
 |
© 2026 Better Solutions Limited. All Rights Reserved. © 2026 Better Solutions Limited TopPrevNext