Category Dates
Time Series Axis
The smallest possible unit is 1 day
If you want to display a smaller unit (time or fractional unit) then you need to use an XY Scatter chart
The time scale axis option is only available for the category axis.
Excel 2013
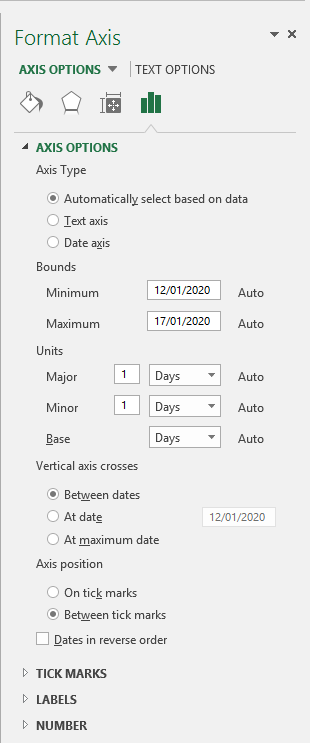 |
Axis Type - Automatically select based on data -
Axis Type - Text Axis -
Axis Type - Date axis -
Bounds - Minimum -
Bounds - Maximum -
Units - Major -
Units - Minor -
Units - Base -
Vertical axis crosses - Between dates -
Vertical axis crosses - At date -
Vertical axis crosses - At maximum date -
Axis position - On tick marks -
Axis position - Between tick marks -
Dates in reverse order - Reverses the order of the series
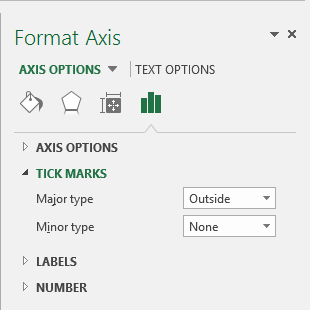 |
Major type -
Minor type -
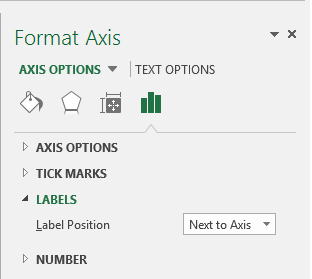 |
Label position - Drop-down containing Next to Axis
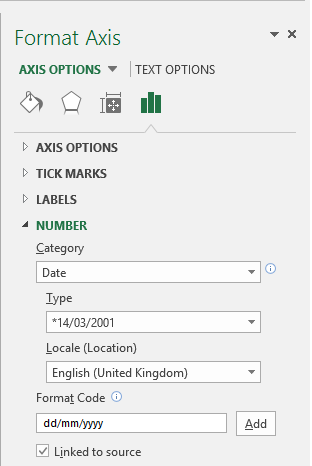 |
Category -
Type -
Locale -
Format Code -
Linked to source -
Excel 2010 and 2007
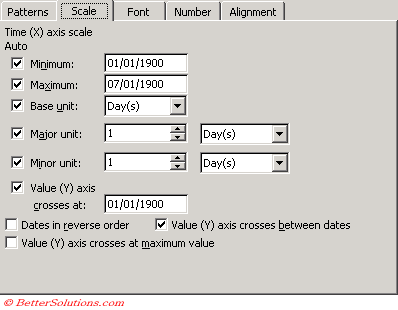
Minimum - The date at which the axis starts.
Maximum - The date at which the axis ends.
Major Unit - The size of the interval. The position for major gridlines.
Minor Unit - The position for minor gridlines.
Base Unit - The unit that is displayed on the axis.
Dates in reverse order - This flips the chart from left to right.
Axis Type - Automatically select based on data - Automatic depending on the type of data.
Axis Type - Text axis - Toggles the axis option settings between Text and Dates.
Axis Type - Date axis - Toggles the axis option settings between Dates and Text.
Major tick mark type - Location of the major tick marks.
Minor tick mark type - Location of the minor tick marks.
Axis labels - Location of the axis labels. Drop-down containing: Next to Axis,
Vertical axis crosses - Between dates - Change the intersection point of the axis.
Vertical axis crosses - At date - Change the intersection point of the axis.
Vertical axis crosses - At maximum date - Change the intersection point of the axis.
Position axis - On tick marks -
Position axis - Between tick marks -
Excel 2003
 |
The data is treated as continuously varying numerical data, and the marker is placed at a point along the axis which varies according to its numerical value.
Time Series data points are positioned in accordance with their chronological order
Time Series points are plotted in chronological order, whether or not the data range is sorted chronologically
Time Series data points use the smallest time period for their base unit, which typically defaults to 1 day
If you have the wrong dates on your axis it may be because your axis is set to automatic selection and therefore not on Category, from where you can select time-series.
© 2026 Better Solutions Limited. All Rights Reserved. © 2026 Better Solutions Limited TopPrevNext