LINEST Function
The LINEST function returns the slope and intercept values for a best fit straight line.
This function includes an option to include additional regression statistics (stats = true).
This function uses the "least squares" method to calculate a best fit line.
y = mx + b
Straight lines satisfy the equation "y=mx+b" when you have one independent x-value.
b is the value where the line crosses the y-axis and corresponds to the "const" argument.
When "const" is left blank (or True) the slope and intercept is calculated and returned.
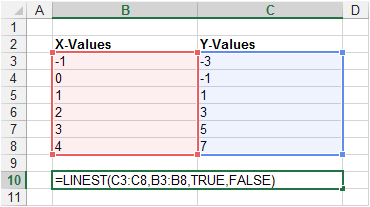
Enter the following data arranged in two columns. One column for the x-values and one for the y-values.
Highlight cells "B10:C10".
You must select two cells in the same row. Not two cells in the same column.
 |
Enter the following formula into the cells "B10:C10".
 |
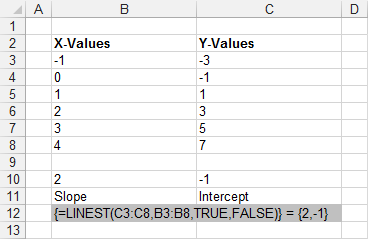
The slope of the best fit straight line has been added to cell "B10".
The intercept of the best fit straight line with the y-axis has been added to cell "C10".
Plotting the Graph
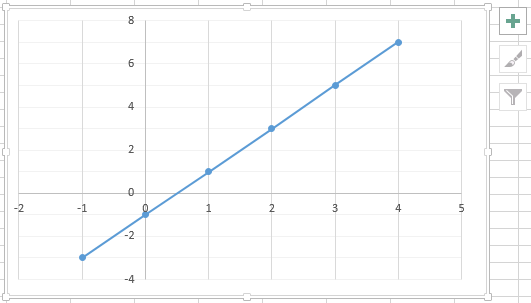
We can check the results by plotting an XY Scatter chart.
The slope of the line is 2.
The intersection of the line with the y-axis is at -1.
 |
Using INTERCEPT and SLOPE
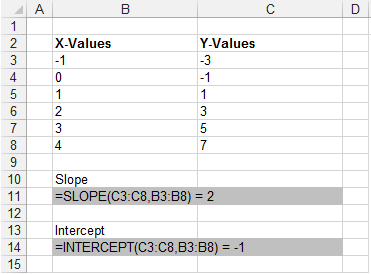
Instead of using the LINEST function you could use the SLOPE and INTERCEPT functions to obtain the same values.
 |
const = False
When "const" is FALSE the slope is calculated with an assumption that the Intercept = 0.
This function now only returns a single value and does not have to be entered as an array formula.
This is the only situation when this function does not return more than one value.
When the intercept is zero, the y-values need to be recalculated using the formula "y=mx"
This formula is completely different to "y=mx+c" and therefore whether "const" is true or false has enormous implications on the results returned by this function.
stats = True
When "stats" is TRUE this function will return additional regression statistics.
Instead of 2 numbers, this function now returns 10 numbers arranged as two columns and five rows.
This table explains what the 10 numbers actually tell us:
| Slope Also known as Beta, written as "m" | Intercept Also known as Alpha, written as "c" or "b" |
| Standard Error for the slope coefficients | Standard Error for the intercept #N/A when const=False |
| RSQ The coefficient of determination, written as r2 | STEYX Standard error for the y estimate |
| The F statistic This is the ratio of the variance in the data explained by the linear model divided by the variance unexplained by the linear model. An even better test for a "good fit" is to use the Fisher F-statistic. | Degrees of Freedom, written as df |
| The Regression Sum of Squares | The residual Sum of Squares |
These additional statistics tell you how good the best fit line is.
The correlation coefficient gives a "rough" indicator of a good fit. Values close to 1 are good.
The uncertainties in the slope and intercept are a much better indicator for a "good fit"
In this case the uncertainties in the slope and the intercept are not as good as the "r2" might have indicated
Determining new Values
Once you know the values of m and b, you can calculate any point on the line by plugging the y- or x-value into that equation. You can also use the TREND function.
In order to determine new x-values for a given set of data points you need to solve the following linear equation
You can use the LINEST and INDEX functions to solve this equation.
Residuals
The residual value is the difference between the value predicted by the equation and the value observed or collected.
If the equation is a close fit then we would expect the residuals to be randomly scattered around zero.
If they display a pattern then it is likely that a better equation exists.
Multiple X-Values
If there are more than one range of x-values then the straight line will satisfy a slightly different equation
y = m1x1 + m2x2 + . . + c
x1-values | x2-values | y-values
Important
Plotting a graph and then adding a trendline gives you slightly more control as you can provide the value for the intercept.
You can quickly enter the squared symbol by using (Alt + 0178).
You can quickly enter the cubed symbol by using (Alt + 0179).
© 2026 Better Solutions Limited. All Rights Reserved. © 2026 Better Solutions Limited TopPrevNext