Change the Chart using a ComboBox on the Chart Area
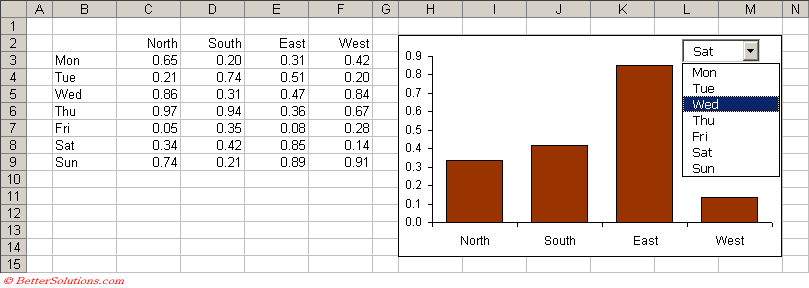
This example shows you how you can change the source data of a chart when you select a different series from a drop-down box.
By selecting a different item in the drop-down you can quickly display the corresponding series of data on the chart.
We are going to use the ComboBox_Change event from a drop-down listbox to detect when a different series has been chosen.
 |
Things to Look Out For
If you select the chart (and not the combo box) the combobox disappears behind the chart temporarily.
Add the ComboBox Control
 |
| Combo Box - Allows the user to either select an item from the drop-down list or to enter a different value into the text box. |
Populate the ComboBox
Private Sub Worksheet_Activate()
Dim irowno As Integer
   For irowno = 3 To 9
      ActiveSheet.ComboBox1.AddItem Range("B" & irowno).Value
   Next irowno
End Sub
ComboBox1_Change Event
Private Sub ComboBox1_Change()
Dim irowno As Integer
Dim rgeData As Range

   irowno = ActiveSheet.ComboBox1.ListIndex + 3
   Set rgeData = Range(Cells(irowno, 3), Cells(irowno, 6))
   ActiveSheet.ChartObjects(1).Chart.SeriesCollection(1).Values = rgeData
   ActiveSheet.ChartObjects(1).Chart.SeriesCollection(1).XValues = Range("C2:F2")
End Sub
Line by Line
Using the Forms Toolbar
Excel does not allow you to add controls from the Control Toolbox Toolbar to a chart sheet.
If you want to add a drop-down list box to a chart which is displayed on a separate chart sheet you must use the Forms toolbar.
 |
The code is almost identical except that we use a DropDown_Change event instead.
| Combo Box - Allows the user to either select an item from the drop-down list or to enter a different value into the text box. |
Private DropDown1_Change
Dim irowno As Integer
   irowno = Charts(1).DropDowns(1).Value + 3

'use the same code as above
End Sub
© 2026 Better Solutions Limited. All Rights Reserved. © 2026 Better Solutions Limited TopPrevNext