Displaying Different Series
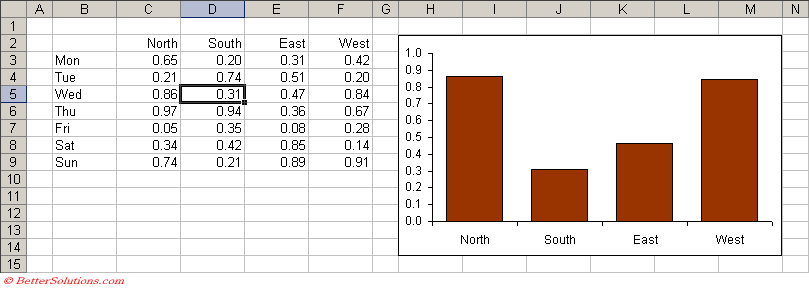
This example shows you how you can change the source data of a chart when you select different cells on a worksheet.
By selecting a row in the table you can quickly display the corresponding series of data on the chart.
We are going to use the Worksheet_SelectionChange event to be able to detect when a different cell is selected.
This chart will always display the data from the row of the active cell.
 |
Things to Look Out For
If you select a range of cells that span multiple rows the first row in the selection will be used.
Worksheet_SelectionChange Event
Every time the user selects a cell on the worksheet this event is fired.
The Target argument contains the range object for the cell (or cells) that are currently selected.
Private Sub Worksheet_SelectionChange(ByVal Target As Range)
Dim rgeData As Range

   If (ActiveCell.Column >= 2 And ActiveCell.Column <= 6) And _
      (ActiveCell.Row >= 3 And ActiveCell.Row <= 9) Then

      Set rgeData = Range(Cells(ActiveCell.Row, 3), Cells(ActiveCell.Row, 6))
      ActiveSheet.ChartObjects(1).Chart.SeriesCollection(1).Values = rgeData
      ActiveSheet.ChartObjects(1).Chart.SeriesCollection(1).XValues = Range("C2:F2")
   End If
End Sub
Line By Line
This event handler will be called when any cell (or range of cells) is selected.
The first thing we need to do is make sure that the active cell is in our table.
We can check this by checking the row and column numbers of the active cell.
If (ActiveCell.Column >= 2 And ActiveCell.Column <= 6) And _
   (ActiveCell.Row >= 3 And ActiveCell.Row <= 9) Then
If the selected cell is not in our table then we don't need to do anything.
This line of code creates a range which corresponds to the row of data we want to display on our chart.
This basically defines the range to be the cells between "C" and "F" on the active row.
Set rgeData = Range(Cells(ActiveCell.Row, 3), Cells(ActiveCell.Row, 6))
This line of code defines the values for the chart to be the range we defined in the previous line.
ActiveSheet.ChartObjects(1).Chart.SeriesCollection(1).Values = rgeData
This line of code defines the chart labels on the X-axis to be the column headings of our table.
ActiveSheet.ChartObjects(1).Chart.SeriesCollection(1).XValues = Range("C2:F2")
© 2026 Better Solutions Limited. All Rights Reserved. © 2026 Better Solutions Limited TopPrevNext