Timeline Table
This can be really useful if you need to keep track of a list of tasks when managing a small project.
You can set yourself timelines when you need to have certain work completed by a specific date.
This type of diagram is just a way of displaying this information visually.
You have dates or times across the top and then tasks or key items down the left hand side.
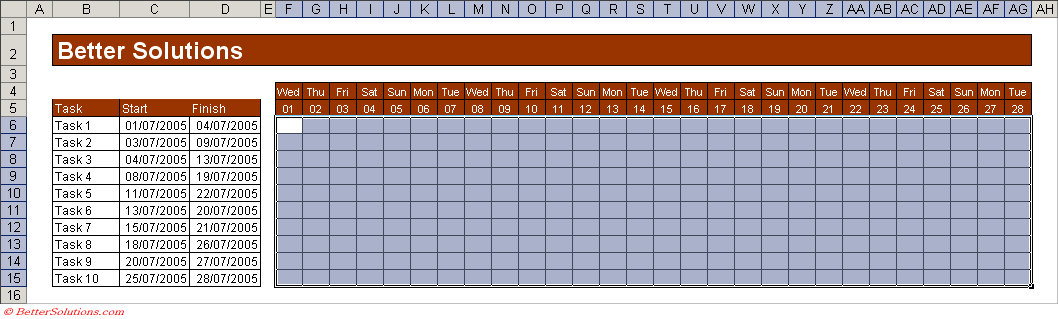
The key is to setup you dates correctly and consistently in the example below we have included a selection of dates in July (including weekends).
Highlight the cells
Create a table that looks similar to the one below.
The start dates are in column "C" and the finish dates are in column "D".
Select the cells you want to apply the conditional formatting to, in this case "F6:AG15".
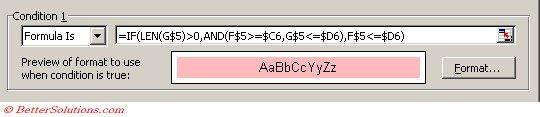
Select the (Format > Conditional Formatting) and select "Formula is" in the first drop-down list.
 |
Check your Data
Make sure that the dates long the top match the dates down the left hand side.
In this examples the cells "F5:AG5" contains actual dates but the cells have been formatted to only display the day component.
Enter the Conditions
You need to use the AND function to be able to reference both the dateline and the relevant start and finish cells.
The formula we are going to use is basically "AND(F$5>=$C6,G$5<=$D6)" to check if the date falls between the start and finish dates.
To make sure that it works for the last column in the table this formula is then placed inside the IF function.
Enter the following formula "=IF(LEN(G$5)>0,AND(F$5>=$C6,G$5<=$D6),F$5<=$D6)".
The cell "F5" is the first date at the top of your table.
The cell "G5" is the second date at the top of your table.
The cell "C6" is
The cell "D6" is
 |
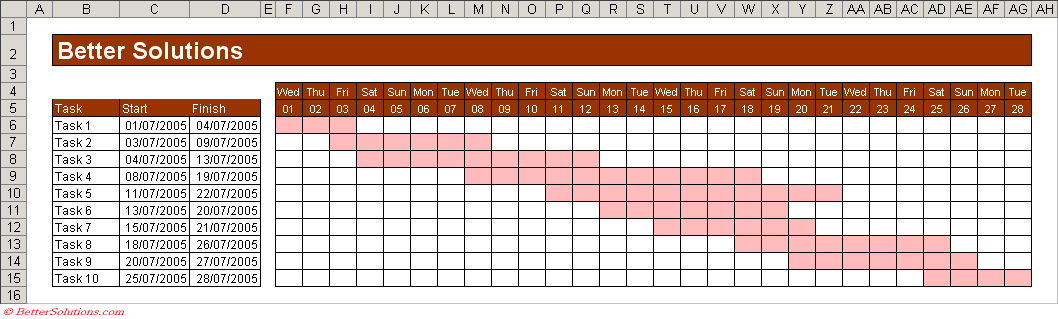
Press OK to apply the conditional formatting.
 |
Displaying several months in the same table
how can this be done and what would it look like.
© 2026 Better Solutions Limited. All Rights Reserved. © 2026 Better Solutions Limited TopPrevNext