Chart Options
Removed in 2007
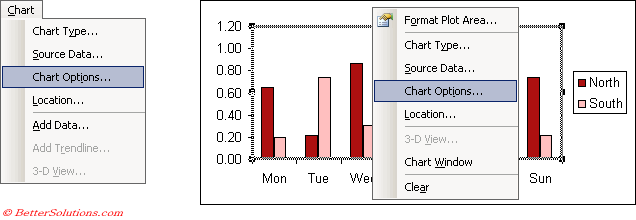
You can access the "Chart Options" dialog box in two ways:
1) Using the Chart Menu.
2) Using the Shortcut Menu (pressing the right mouse button).
 |
Title Options
You can include a chart title as well as adding titles to all the axes.
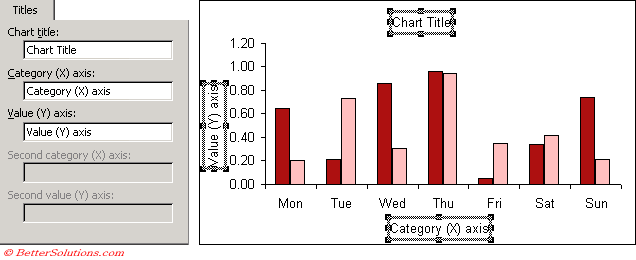 |
Chart Title - This lets you add a title above the plot area.
Category (X) axis - This lets you add a title below the x-axis.
Value (Y) axis - This lets you add a title to the left of the y-axis.
Second category (X) axis - This is only available if your chart has a secondary axis.
Second value (Y) axis - This is only available if your chart has a secondary axis and is used to add an axis title.
You can edit titles directly after they have been added to a chart by selecting the individual item with the left mouse button and editing the text.
To deselect a title after editing move the mouse anywhere outside the text area and press the left mouse button.
Axes Options
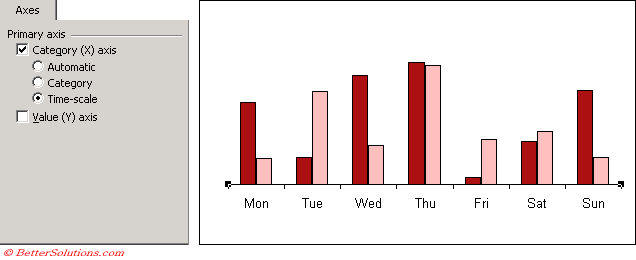
You can decide if you want to display the x-axis as dates or as categories.
 |
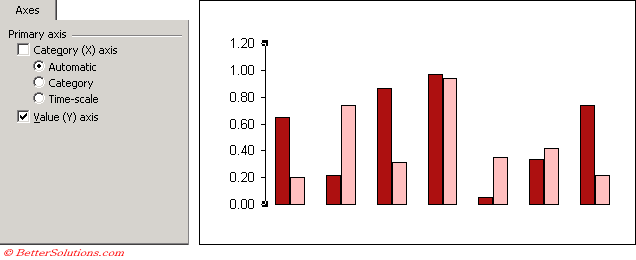 |
Category (X) axis - This is the horizontal axis at the bottom of the chart. The three different options are discussed later.
Value (Y) axis - This is the vertical axis on the left of the chart.
Gridline Options
You can decide if you want to display major and minor gridlines to both the axes.
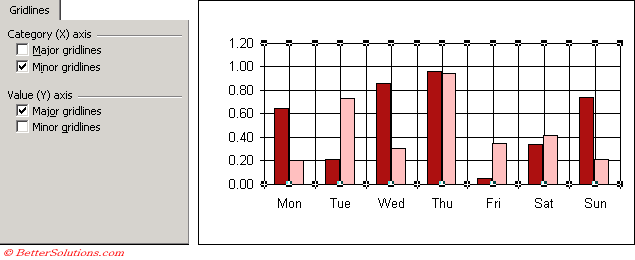 |
Major Gridlines - Major tick marks are the ticks which have a value against them on the axis.
Minor Gridlines - Minor tick marks are the ticks which are between the ticks that have a value against them. The number of minor ticks that will appear between each major tick can be changed by displaying the axis shortcut menu and selecting (Format Axis)(Scale tab).
Legend Options
You can decide if you want to display a legend to identify the different series.
The legend is determined from either the first column of data or the first row of data depending on whether the series are horizontally or vertically.
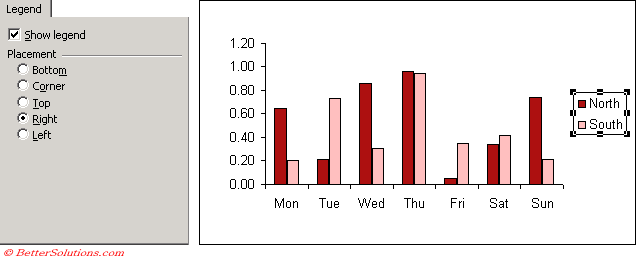 |
Show Legend - This determines whether a legend is displayed on the active chart.
Placement - This determines the exact position of the legend. The most common place to put the legend is either to the right or below the plot area.
Data Labels Options
You can decide if you want to display the actual values, percentages and other information.
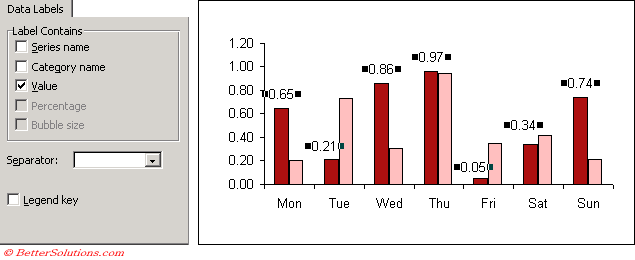 |
Series Name - This displays the series name next to each point (North or South).
Category Name - This displays the category axis name next to each point (Mon, Tue, Wed, Thu, Fri, Sat, Sun).
Value - This displays the actual data point value next to each data point (0.65, 0.21, 0.86, 0.97, 0.05, 0.34, 0.74).
Percentage - Only applicable to pie charts.
Bubble Size - Only applicable to bubble charts.
Separator - The character to use if you want to display more than one of the above. The character can be any of the following: space, comma, semicolon, full stop or displayed on a new line.
Legend Key - This allows you to include a small legend key next to the item that is displayed.
Data Table Options
You can decide if you want to display a data table showing the actual values used for the chart.
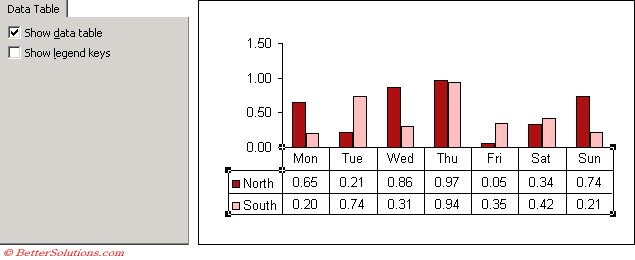 |
Show Data Table - This displays a table at the bottom of your chart displaying the actual data used to create the chart
Show Legend Keys - This allows you to include a small legend key within the first column of the data table.
Tools > Options
There are also some Chart specific options on the (Tools > Options)(Chart tab).
 |
You will only be able to change these settings if you currently have a chart active.
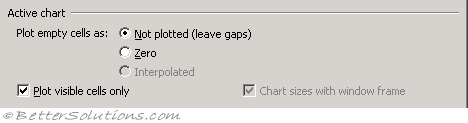
Plot empty cells as - There are three choices: "Not Plotted" which ignores any blank cells and leaves gaps in the line: "Zero" which means blank cells are treated as zero, so the line drops to the zero-scale: "Interpolated" which means that any blank cells will have a connecting line meaning there are no gaps.
Plot visible cells only - If ticked will only plot visible cells and any hidden cells will not be plotted.
Chart sizes with window frame - This is only appropriate for charts on separate chart sheets, not for embedded charts. This will ensure the chart always fills the window.
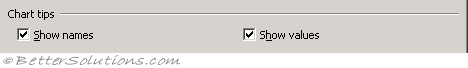 |
Show names - Displays the item of the chart when you hover over it.
Show values - Displays the value of a data marker when you hover over it.
Important
The chart options dialog box is a good place to experiment with the presentation of your chart. Pressing the Cancel will not save any of your changes.
© 2026 Better Solutions Limited. All Rights Reserved. © 2026 Better Solutions Limited TopPrevNext