Anova Single Factor
Analysis of Variance (ANOVA)
Analysis of Variances is a method of checking if there is a relationship between two or more data sets.
You can determine if there is a relationship between data sets by performing an analysis of variance, otherwise known as ANOVA.
An analysis of variances is sometimes referred to as an F-Test after the British statistician R. A. Fisher.
There are actually three different types of ANOVA that are available through the Analysis-ToolPak
Single Factor - This performs a simple analysis of variances between two data sets.
Two Factor without Replication - This performs an analysis of variances between two or more data sets. This should be used when you only have one sample from each data set.
Two Factor with Replication - This performs an analysis of variances between two more data sets. This should be used when you have more than one sample from each data set.
When analysis of variance is applied to two groups it gives the same result as a Z-test or T-test.
All ANOVA tests utilize the F distribution.
Using Anova Single Factor
This compares the means of two samples to determine if there is a relationship between the two data sets.
This assumes one sampling
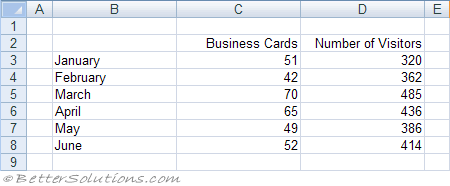
We are going to perform an Anova single factor to determine if there is a direct relationship between the number of business cards we give out and the number of people who visit our website.
To perform this calculation you must provide the range of cells containing the values you want to analyse as well as the statistical confidence level. This is alpha
There are four people who are responsible for distributing business cards.
 |
Select (Tools > Data Analysis)
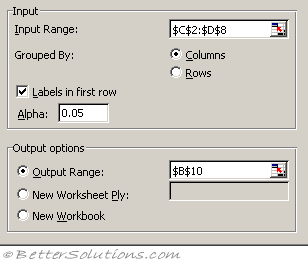 |
Input Range - Enter the cell reference for the range of data you want to analyse. The reference must consist of two or more adjacent ranges of data arranged in columns or rows.
Grouped By - To indicate whether the data in the input range is arranged in rows or in columns, click Rows or Columns.
Labels in First Row/Labels in First Column - If the first row of your input range contains labels, select the Labels in First Row check box. If the labels are in the first column of your input range, select the Labels in First Column check box. This check box is clear if your input range has no labels; Microsoft Excel generates appropriate data labels for the output table.
Alpha - The alpha field is the probability that there is a direct relationship. The default is 0.05 = 5%. Enter the level at which you want to evaluate critical values for the F statistic. The alpha level is a significance level related to the probability of having a type I error (rejecting a true hypothesis).
New Worksheet Ply - Click to insert a new worksheet in the current workbook and paste the results starting at cell A1 of the new worksheet. To name the new worksheet, type a name in the box.
Output Range - Enter the reference for the upper-left cell of the output table. Excel automatically determines the size of the output area and displays a message if the output table will replace existing data or extend beyond the bounds of the worksheet.
New Workbook - Click to create a new workbook and paste the results on a new worksheet in the new workbook.
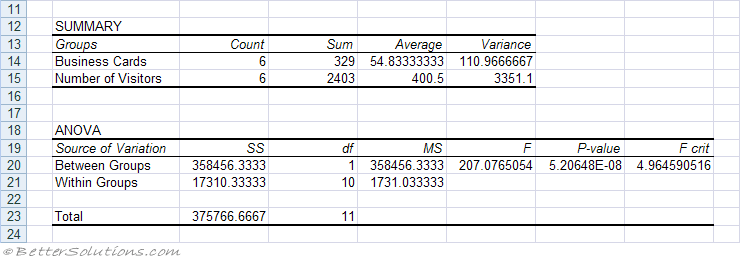 |
SS -
df -
MS -
F - If F is close to 1 then there is a direct relationship
P-value -
F crit -
T-Test
An ANOVA (or F-Test) and is closely related to the T-Test.
The major difference is that the T-Test measures the difference between the means of two data sets where as the F-Test measures the difference between the means of two or more data sets.
The advantage of using ANOVA rather than multiple T-Tests is that it reduces the probability of an I-type error. Making multiple comparisons increases the likelihood of finding something by chance (i.e. making an I-type error).
An ANOVA controls the overall error by testing all the means against each other as the same time.
Important
In order to use the ANOVA test successfully the variances for each of the data sets must be the same.
Depending on the number of data sets and the number of samples you have will depend on which type of ANOVA you use.
The Anova Single Factor is also known as "One way Analysis of Variance" or "One way ANOVA"
Mean - The average
Standard Error - The square root of a sample size (n) divided by the standard deviation over the square root of the sample size (n)
Median - The middle value
Mode - The most common value
Standard Deviation - The dispersion of the group of values.
© 2026 Better Solutions Limited. All Rights Reserved. © 2026 Better Solutions Limited TopPrevNext