Descriptive Statistics
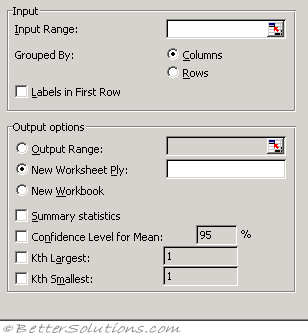 |
Input Range - Enter the cell reference for the range of data you want to analyse. The reference must consist of two or more adjacent ranges of data arranged in columns or rows.
Grouped By - To indicate whether the data in the input range is arranged in rows or in columns, click Rows or Columns.
Labels in First Row/Labels in First Column - If the first row of your input range contains labels, select the Labels in First Row check box. If the labels are in the first column of your input range, select the Labels in First Column check box. This check box is clear if your input range has no labels; Microsoft Excel generates appropriate data labels for the output table.
Confidence Level for Mean - Select if you want to include a row in the output table for the confidence level of the mean. In the box, enter the confidence level you want to use. For example, a value of 95 percent calculates the confidence level of the mean at a significance of 5 percent.
Kth Largest - Select if you want to include a row in the output table for the kth largest value for each range of data. In the box, enter the number to use for k. If you enter 1, this row contains the maximum of the data set.
Kth Smallest - Select if you want to include a row in the output table for the kth smallest value for each range of data. In the box, enter the number to use for k. If you enter 1, this row contains the minimum of the data set.
Output Range - Enter the reference for the upper-left cell of the output table. This tool produces two columns of information for each data set. The left column contains statistics labels, and the right column contains the statistics. Excel writes a two-column table of statistics for each column or row in the input range, depending on the Grouped By option selected.
New Worksheet Ply - Click to insert a new worksheet in the current workbook and paste the results starting at cell A1 of the new worksheet. To name the new worksheet, type a name in the box.
New Workbook - Click to create a new workbook and paste the results on a new worksheet in the new workbook.
Summary statistics - Select if you want Excel to produce one field for each of the following statistics in the output table: Mean, Standard Error (of the mean), Median, Mode, Standard Deviation, Variance, Kurtosis, Skewness, Range, Minimum, Maximum, Sum, Count, Largest (#), Smallest (#), and Confidence Level.
The Descriptive Statistics analysis tool generates a report of univariate statistics for data in the input range, providing information about the central tendency and variability of your data.
Mean - This the arithmetic mean otherwise known as the average. Same as the AVERAGE function.
Standard Error - Estimate of the error in the sample mean
Median - This is the value in the middle. Same as the MEDIAN function.
Mode - This is the most common value
Standard Deviation - A measure of the variability of the data. Same as STDEV.S function.
Sample Variance - The square of the standard deviation. Same as the VAR.S function.
Kurtosis - Measures the heaviness of the tails of the distribution. Same as KURT function.
Skewness - Index of whether the values are at one end of the distribution. Same as SKEW function.
Range - The difference between the maximum and the minimum.
Minimum - The smallest value
Maximum - The largest value
Sum - The sum of all the values. Same as SUM function.
Count - The total number of values. Same as COUNT function.
© 2026 Better Solutions Limited. All Rights Reserved. © 2026 Better Solutions Limited TopPrevNext