Exponential Smoothing
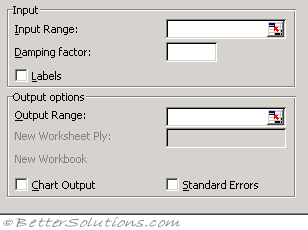 |
Input Range - Enter the cell reference for the range of data you want to analyse. The range must contain a single column or row with four or more cells of data.
Damping factor - Enter the damping factor you want to use as the exponential smoothing constant. The damping factor is a corrective factor that minimizes the instability of data collected across a population. The default damping factor is 0.3.
Note Values of 0.2 to 0.3 are reasonable smoothing constants. These values indicate that the current forecast should be adjusted 20 to 30 percent for error in the prior forecast. Larger constants yield a faster response but can produce erratic projections. Smaller constants can result in long lags for forecast values.
Labels - Select if the first row and column of your input range contain labels. Clear this check box if your input range has no labels; Microsoft Excel generates appropriate data labels for the output table.
Output Range - Enter the reference for the upper-left cell of the output table. If you select the Standard Errors check box, Excel generates a two-column output table with standard error values in the right column. If there are insufficient historical values to project a forecast or calculate a standard error, Excel returns the #N/A error value. Note The output range must be on the same worksheet as the data used in the input range. For this reason, the New Worksheet Ply and New Workbook options are unavailable.
Chart Output - Select to generate an embedded chart for the actual and forecast values in the output table.
Standard Errors - Select if you want to include a column that contains standard error values in the output table. Clear if you want a single-column output table without standard error values.
The Exponential Smoothing analysis tool predicts a value based on the forecast for the prior period, adjusted for the error in that prior forecast.
The tool uses the smoothing constant a, the magnitude of which determines how strongly forecasts respond to errors in the prior forecast.
Note Values of 0.2 to 0.3 are reasonable smoothing constants. These values indicate that the current forecast should be adjusted 20 to 30 percent for error in the prior forecast. Larger constants yield a faster response but can produce erratic projections. Smaller constants can result in long lags for forecast values.
© 2026 Better Solutions Limited. All Rights Reserved. © 2026 Better Solutions Limited TopPrevNext