Fourier Analysis
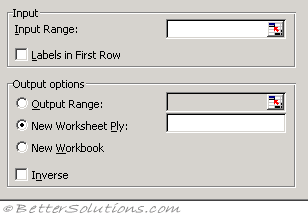 |
Input Range - Enter the reference for the range of real or complex data you want to transform. Complex data must be in either x+yi or x+yj format. The number of input range values must be an even power of 2. If x is a negative number, precede it with an apostrophe ( ' ). The maximum number of values is 4096.
Labels in First Row - Select if the first row of your input range contains labels. Clear if your input range has no labels; Microsoft Excel generates appropriate data labels for the output table.
Output Range - Enter the reference for the upper-left cell of the output table. Excel automatically determines the size of the output area and displays a message if the output table will replace existing data.
New Worksheet Ply - Click to insert a new worksheet in the current workbook and paste the results starting at cell A1 of the new worksheet. To name the new worksheet, type a name in the box.
New Workbook - Click to create a new workbook and paste the results on a new worksheet in the new workbook.
Inverse - If selected, the data in the input range is considered transformed and an inverse transformation is performed, returning the original inputs. If cleared, the data in the input range is transformed in the output table.
The Fourier Analysis tool solves problems in linear systems and analyses periodic data by using the Fast Fourier Transform (FFT) method to transform data. This tool also supports inverse transformations, in which the inverse of transformed data returns the original data.
© 2026 Better Solutions Limited. All Rights Reserved. © 2026 Better Solutions Limited TopPrevNext