Covariance
Covariance is the measure of how much two sets of data vary.
The Covariance determines the degree to which the two variables are related or how they vary together.
The Covariance is the average of the product of deviations of data points from their respective means, based on the following formula.
Variance and Covariance
It is important to remember the difference between variance and covariance:
Variance - This is a measure of how much a single variable changes.
Covariance - This is a measure of how much two variables change together.
Using Covariance
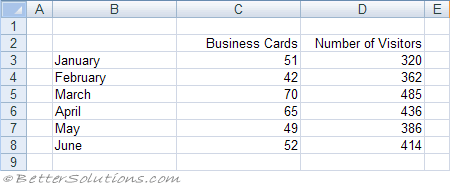
We want to find the covariance for the number of business cards we give out and the number of people who visit our website.
Lets assume we have the following table of data.
 |
Select (Tools > Data Analysis) and choose Covariance in the Data Analysis dialog box.
Press OK to display the Covariance dialog box.
Specify the input range to be C2:D8 and specify the output to be pasted in cell "B10" below this table.
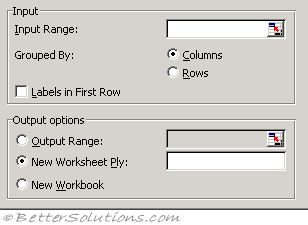 |
Input Range - Enter the cell reference for the range of data you want to analyse. The reference must consist of two or more adjacent ranges of data arranged in columns or rows.
Grouped By - To indicate whether the data in the input range is arranged in rows or columns, click Rows or Columns.
Labels in First Row/Labels in First Column - If the first row of your input range contains labels, select the Labels in First Row check box. If the labels are in the first column of your input range, select the Labels in First Column check box. This check box is clear if your input range has no labels; Microsoft Excel generates appropriate data labels for the output table.
Output Range - Enter the reference for the upper-left cell of the output table. Excel populates only half of the table because covariance between two ranges of data is independent of the order in which the ranges are processed. The table's diagonal contains the variance of each range.
New Worksheet Ply - Click to insert a new worksheet in the current workbook and paste the results starting at cell A1 of the new worksheet. To name the new worksheet, type a name in the box.
New Workbook - Click to create a new workbook and paste the results on a new worksheet in the new workbook.
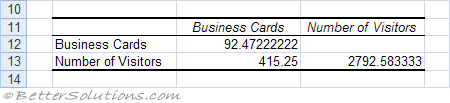
This will create a table showing the covariance value between the two data sets.
 |
Positive Covariance
When the 2 variables tend to vary together.
For example when one of them is above the expected value, then the other variable is also above its expected value.
The variables are increasing together
Negative Covariance
For example when one variable is above the expected value
The first variable tends to increase as the first variable decreases.
Zero Covariance
You cannot predicate a correlation between the two variables.
Covariance is a measure of the relationship between two ranges of data.
You can use the covariance tool to determine whether two ranges of data move together, that is, whether large values of one set are associated with large values of the other (positive covariance), whether small values of one set are associated with large values of the other (negative covariance), or whether values in both sets are unrelated (covariance near zero).
Important
The correlation coefficient can also be obtained using the COVAR worksheet function.
The Covariance value with itself is its Variance. COVAR(X,X) = VARP(X)
© 2026 Better Solutions Limited. All Rights Reserved. © 2026 Better Solutions Limited TopPrevNext