Regression
The Regression analysis tool performs linear regression analysis by using the "least squares" method to fit a line through a set of observations.
Regression attempts to show the relationship between two variables by providing a mean line which best indicates the trend of the co-ordinates.
The Regression analysis tool performs linear regression analysis by using the "least squares" method to fit a line through a set of observations.
You can analyse how a single dependent variable is affected by the values of one or more independent variables.
It can be shown mathematically that the best line is one that minimises the total of the squared deviations.
This is known as the method of least squares.
All linear regressions take the equation y = mx + b
The best fit line can be defined mathematically as:
"the line where the sum of squares of the differences to all data points has the smallest possible value"
The line is called the "least square fit" and the process of finding this line is called "least square fit regression"
Using Regression
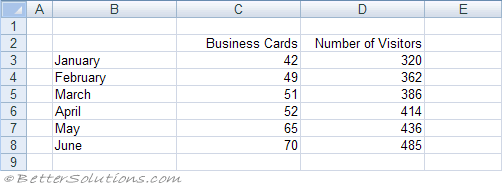
Lets assume we have the following table of data.
 |
Select (Data > Data Analysis) and choose Regression in the Data Analysis dialog box.
Press OK to display the Regression dialog box.
Specify the input Y range as C2:C8 and the input X range as D2:D8.
Specify the output to be pasted in cell "B11" below this table.
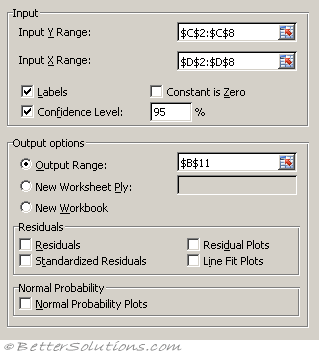 |
Input X Range - Enter the reference for the range of independent data. Microsoft Excel orders independent variables from this range in ascending order from left to right. The maximum number of independent variables is 16.
Labels - Select if the first row or column of your input range or ranges contains labels. Clear if your input has no labels; Excel generates appropriate data labels for the output table.
Confidence Level - Select to include an additional level in the summary output table. In the box, enter the confidence level you want applied in addition to the default 95 percent level.
Constant is Zero - Select to force the regression line to pass through the origin.
Output Range - Enter the reference for the upper-left cell of the output table. Allow at least seven columns for the summary output table, which includes an anova table, coefficients, standard error of y estimate, r2 values, number of observations, and standard error of coefficients.
New Worksheet Ply - Click to insert a new worksheet in the current workbook and paste the results starting at cell A1 of the new worksheet. To name the new worksheet, type a name in the box.
New Workbook - Click to create a new workbook and paste the results on a new worksheet in the new workbook.
Residuals - Select to include residuals in the residuals output table.
Standardized Residuals - Select to include standardized residuals in the residuals output table.
Residual Plots - Select to generate a chart for each independent variable versus the residual.
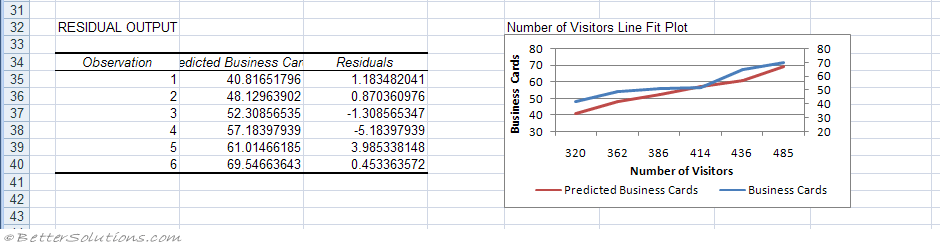
Line Fit Plots - Select to generate a chart for predicted values versus the observed values.
Normal Probability Plots - Select to generate a chart that plots normal probability.
This generates the following output
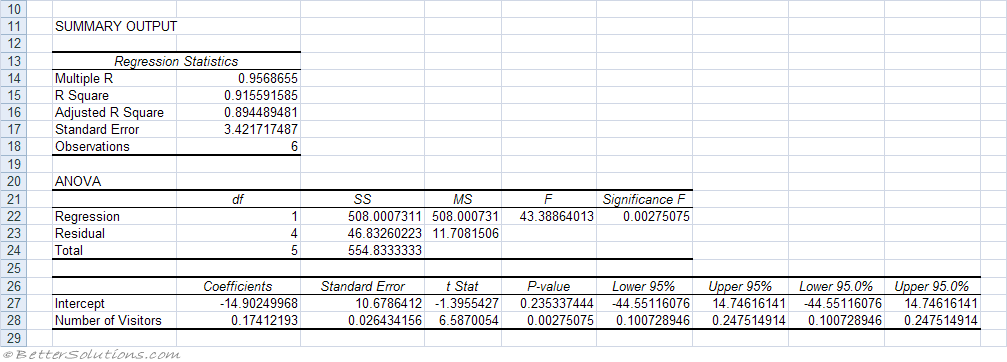 |
Multiple R - This is the correlation coefficient and is the square root of "R Square".
R Square - The square of the correlation coefficient.
Adjusted R Square -
Standard Error - This should really be labelled as "estimated standard deviation of errors"
Observations - The number of data points.
Line Fit Plots
 |
Linear Regression
A linear regression produces the slope of a line that best fits a single set of data points.
For example a linear regression could be used to help project the sales for next year based on the sales from this year.
This assumes that growth will remain linear for the next year.
Excel includes several array functions for performing linear regressions:
INTERCEPT - The intersection with the y-axis using a linear regression plotted through known values.
LINEST - The array of values for a straight line that best fits the data. Provides the standard errors of estimates and a rudimentary analysis of variance ?
TREND - The y-values along a linear trend given a set of x-values.
FORECAST.LINEAR - The future value along a linear trend by using existing values.
SLOPE - The slope of a linear regression line through the given data points.
STEYX - The standard error of the predicted y-values for each x regression.
Exponential Regression
An exponential regression produces an exponential curve that best fits a single set of data points.
For example an exponential regression could be used to represent the growth of a population. This would be a better representation than using a linear regression.
Excel includes several array functions for performing exponential regressions:
LOGEST - The array of values for an exponential curve that best fits the data.
GROWTH - The predicted exponential growth using existing values.
Multiple Regression
This is the analysis of more than one set of data points and can often produce more accurate results.
You can perform both linear and exponential regression analysis with more than one set of data points.
For example a multiple regression could be used to project the price of houses in your area based on their size, age and location.
Using Linear Regression
For an illustrated example refer to the page under Advanced Functions.
The equation "y = mx + b" describes a straight line for a single set of data points with one independent variable (x).
In this equation "y" is the dependent variable, "m" is the gradient of the slope and "b" is the point of interception with the y-axis.
In the case of multiple regression the equation becomes "y = m1x1 + m2x2 + .. + mnxn + b".
In this equation "y" is the dependent variable, "x1" to "xn" are the independent variables and "mn" are the corresponding coefficients of each of the independent variables and "b" is a constant.
The LINEST function uses this more general equation to return the values of "m1" through to "mn" and the given value of the constant "b".
The parameters that need to be passed to the function are the known set of values for "y" and a known set of values for each independent variable "x"
Important
Regression is often used to help predict the future.
The only difference between the LINEST and LOGEST functions is that the LINEST function projects a straight line and LOGEST projects an exponential curve.
© 2026 Better Solutions Limited. All Rights Reserved. © 2026 Better Solutions Limited TopPrevNext