Anova Two Factor
With Replication
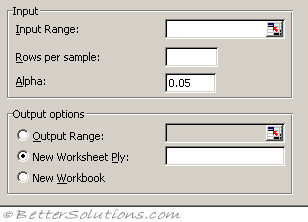 |
Input Range - Enter the cell reference for the range of data you want to analyse. The reference must consist of two or more adjacent ranges of data arranged in columns or rows.
Rows per sample - Enter the number of rows contained in each sample. Each sample must contain the same number of rows, because each row represents a replication of the data.
Alpha - Enter the level at which you want to evaluate critical values for the F statistic. The alpha level is a significance level related to the probability of having a type I error (rejecting a true hypothesis).
Output Range - Enter the reference for the upper-left cell of the output table. Microsoft Excel automatically determines the size of the output area and displays a message if the output table will replace existing data or extend beyond the bounds of the worksheet.
New Worksheet Ply - Click to insert a new worksheet in the current workbook and paste the results starting at cell A1 of the new worksheet. To name the new worksheet, type a name in the box.
New Workbook - Click to create a new workbook and paste the results on a new worksheet in the new workbook.
You can use this tool if you think that there may be a direct relationship between three sets of data to a third
Use this when you want to sample each group more than once.
Anova: Two-Factor With Replication This analysis tool performs an extension of the single-factor anova that includes more than one sample for each group of data.
Without Replication
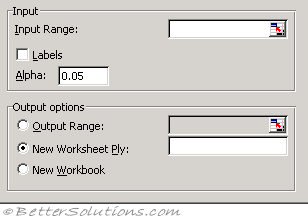 |
Input Range - Enter the cell reference for the range of data you want to analyse. The reference must consist of two or more adjacent ranges of data arranged in columns or rows.
Labels - This check box is clear if your input range has no labels; Microsoft Excel generates appropriate data labels for the output table.
Alpha - Enter the level at which you want to evaluate critical values for the F statistic. The alpha level is a significance level related to the probability of having a type I error (rejecting a true hypothesis).
Output Range - Enter the reference for the upper-left cell of the output table. Excel automatically determines the size of the output area and displays a message if the output table will replace existing data or extend beyond the bounds of the worksheet.
New Worksheet Ply - Click to insert a new worksheet in the current workbook and paste the results starting at cell A1 of the new worksheet. To name the new worksheet, type a name in the box.
New Workbook - Click to create a new workbook and paste the results on a new worksheet in the new workbook.
You use this when you have one sample of each group of data
Anova: Two-Factor Without Replication This analysis tool performs a two-factor anova that does not include more than one sampling per group, testing the hypothesis that means from two or more samples are equal (drawn from populations with the same mean). This technique expands on tests for two means, such as the t-test.
© 2026 Better Solutions Limited. All Rights Reserved. © 2026 Better Solutions Limited TopPrevNext