Rank and Percentile
The Rank and Percentile contained within the Analysis-ToolPak can be quickly used to find the rank of all the values in a list.
The advantage of using the Rank and Percentile feature is that the percentile is also added to the output table.
The percentile is a percentage that indicates the proportion of the list which is below a given number.
Highlight the list (or the cells) which you want the corresponding of. In this case cells "B2:B15".
Select (Tools > Data Analysis) and select "Rank and Percentile" from the list.
Input Range - This is the cell reference for the list of numbers (or range of data) you want to analyse.
Grouped By - This indicates whether the input range is arranged by columns or by rows. In this case the data is arranged in a single column.
Labels in First Row - If your data is arranged in columns the first row of your data can contains labels. This checkbox needs to be ticked if the first row does contain labels. These labels will be transferred to the output table automatically if specified. In this case we do have a label in the first row.
Output Range - This is the upper-left cell for the output table. Excel generates one output table for each column or row of data. In this case we only have a single column so we will only get one output table.
New Worksheet Ply - Click to insert a new worksheet in the current workbook and paste the results starting at cell A1 of the new worksheet. To name the new worksheet, type a name in the box.
New Workbook - Click to create a new workbook and paste the results on a new worksheet in the new workbook.
Each output table contains four columns:
Point - The location of the value within the original list. This can be used to quickly sort the output table into the same order of the original list.
Original - This is the column containing the original values. This column has the same column name as the original list since we used labels in the first row.
Rank - This is the rank of the corresponding number in the list.
Percent - This is the numbers percentage rank within the list. This percentage indicates the proportion of the list which are below this given number.
What is the Rank ?
Lets assume that you have a list of numbers and you want to rank these numbers in some kind of order.
You could easily sort the numbers into ascending or descending order which is fine if you do not have any duplicates.
The ranking of values in a list can either be done in ascending or descending order, although descending in the most common.
In a descending order rank, the highest score gets a rank of 1.
In an ascending order rank, the lowest score gets a rank of 1.
When you have duplicates though finding the rank of a particular number in the list becomes a little more difficult.
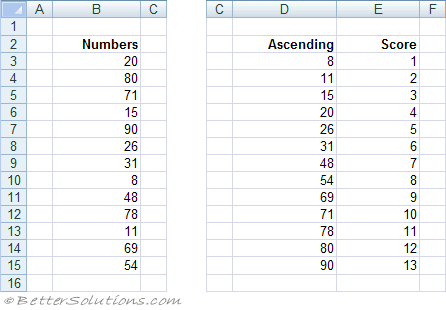
The first thing to do if you want to rank a list of numbers is to count the number of values you have. In this case there are 13.
Sort all the values into ascending order and next to each value starting at the top with the number 1 proceed to score all the values until the last value has a score of 13.
After you have done this you need to identify if there are any duplicate values in the list.
In this particular list there are three values that appear twice (8, 26 and 69) and there is one value that occurs three times (31).
When you have a duplicate the score (or rank) associated with this number must reflect the fact that there was a duplicate.
When a number appears two times the corresponding rank is the total of the two scores divided by 2.
In the case of the number 69 that appears twice the score next to these numbers would become 4.5 (i.e. (4+5)/2 ).
In the case of the number 26 that appears twice the score next to these numbers would become 9.5 (i.e. (9+10)/2 ).
In the case of the number 8 that appears twice the score next to these numbers would become 12.5 (i.e. (12+13)/2 ).
In the case of the number 31 that appears three time the score next to these three numbers would become 7 (i.e. (6+7+8)/3 ).
RANK.EQ Function
RANK.EQ returns the rank of a number in a list of numbers.
Returns the rank of a number in a list of numbers.
This function can be used to quickly obtain the rank of a particular number in a list.
Notice that this function assigns an equal rank (rather than an average) to any duplicate values.
For an illustrated example refer to the page under Advanced Functions.
PERCENTILE.INC Function
PERCENTILE.INC
The Kth percentile of values in an array of numbers.
For an illustrated example refer to the page under Advanced Functions.
Lets assume that we have 13 numbers and we want to find the value of the 45th percentile.
 |
Calculating the Percentile - Excel
There are several ways of calculating a percentile but first lets describe the method used in Excel.
This formula will always provide you with the lowest possible percentile
Step 1 - Sort the list of numbers into ascending order and score these numbers from 1 to 13.
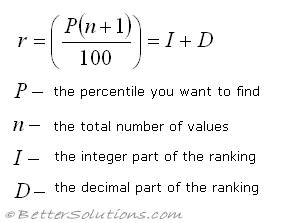
Step 2 - Use the following formula to calculate the corresponding ranking (split into an integer and a decimal).
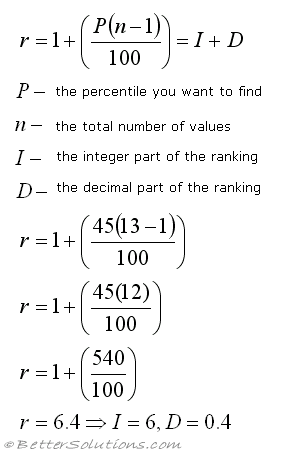 |
Step 3 - Use the following formula to Interpolate between the necessary two numbers.
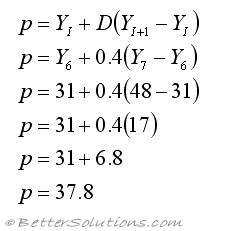 |
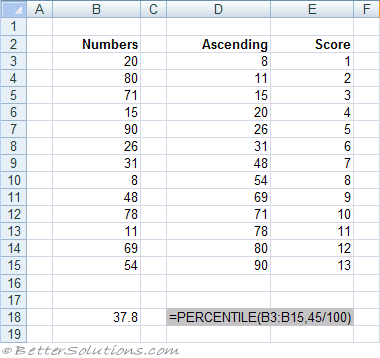
This can then be easily checked by using the worksheet function.
 |
Calculating the Percentile - Weibull
Another common way of calculating a percentile is to use a slightly different formula.
This formula will always provide you with the highest possible percentile.
The process is exactly the same as described above except that the formula to calculate the ranking (split into an integer and a decimal) is different:
 |
Important
You can only rank one column or row of values at a time. If you select multiple rows and columns only the first one will be analysed.
You can only have a label in the first row of a column. If the range contains any other text then an error message is displayed.
© 2026 Better Solutions Limited. All Rights Reserved. © 2026 Better Solutions Limited TopPrevNext