Z-Test Two Sample
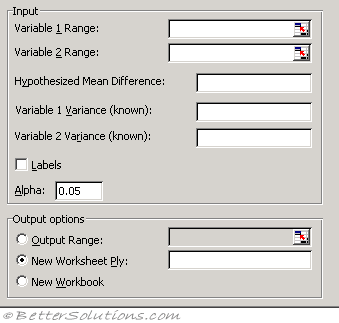 |
Variable 1 Range - Enter the cell reference for the first range of data you want to analyse. The range must consist of a single column or row of data.
Variable 2 Range - Enter the cell reference for the second range of data you want to analyse. The range must consist of a single column or row of data.
Hypothesized Mean Difference - Enter the number you want for the shift in sample means. A value of 0 (zero) indicates that the sample means are hypothesized to be equal.
Variable 1 Variance (known) - Enter the known population variance for the Variable 1 input range.
Variable 2 Variance (known) - Enter the known population variance for the Variable 2 input range.
Labels - Select if the first row or column of your input ranges contains labels. Clear this check box if your input ranges have no labels; Microsoft Excel generates appropriate data labels for the output table.
Alpha - Enter the confidence level for the test. This value must be in the range 0...1. The alpha level is a significance level related to the probability of having a type I error (rejecting a true hypothesis).
Output Range - Enter the reference for the upper-left cell of the output table. Excel automatically determines the size of the output area and displays a message if the output table will replace existing data.
New Worksheet Ply - Click to insert a new worksheet in the current workbook and paste the results starting at cell A1 of the new worksheet. To name the new worksheet, type a name in the box.
New Workbook - Click to create a new workbook and paste the results on a new worksheet in the new workbook.
The z-Test: Two Sample for Means analysis tool performs a two-sample z-test for means with known variances. This tool is used to test hypotheses about the difference between two population means.
For example, you can use this test to determine differences between the performances of two car models.
© 2026 Better Solutions Limited. All Rights Reserved. © 2026 Better Solutions Limited TopPrevNext