Correlation
Correlation is basically whether or not there is any relationship between two sets of data.
If there is any kind of relationship then a change in one variable can be associated with a change in the other.
A lot of relationships are in fact linear but very few are actually perfect because there are normally other factors involved.
The Correlation component of the Analysis-ToolPak will only tell you if there is a correlation.
It will not tell you to what extent the two data sets are related. For this you need to use the Covariance component.
The population correlation calculation returns the covariance of the two data sets divided by the product of their standard deviations.
Using Correlation
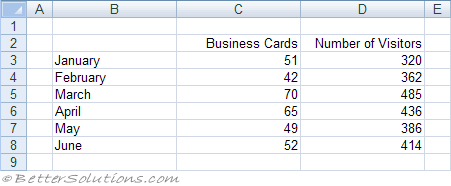
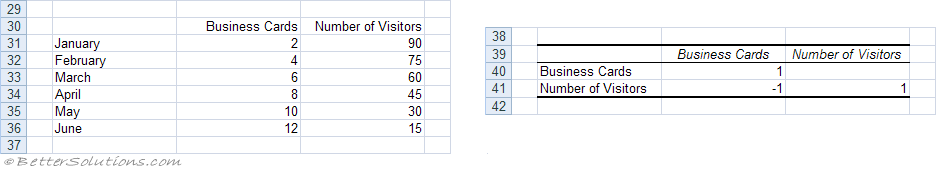
We are going to check to see if there is a correlation between the number of business cards we give out and the number of people who visit our website.
Lets assume we have the following table of data.
 |
Select (Tools > Data Analysis) and choose Correlation in the Data Analysis dialog box.
Press OK to display the Correlation dialog box.
Specify the input range to be C2:D8 and specify the output to be pasted in cell "B10" below this table.
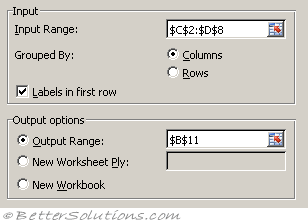 |
Input Range - Enter the cell reference for the range of data you want to analyse. The reference must consist of two or more adjacent ranges of data arranged in columns or rows.
Grouped By - To indicate whether the data in the input range is arranged in rows or in columns, click Rows or Columns.
Labels in First Row/Labels in First Column - If the first row of your input range contains labels, select the Labels in First Row check box. If the labels are in the first column of your input range, select the Labels in First Column check box. This check box is clear if your input range has no labels; Microsoft Excel generates appropriate data labels for the output table.
Output Range - Enter the reference for the upper-left cell of the output table. Excel populates only half of the table because correlation between two ranges of data is independent of the order in which the ranges are processed. Cells in the output table with matching row and column coordinates contain the value 1 because each data set correlates exactly with itself.
New Worksheet Ply - Click to insert a new worksheet in the current workbook and paste the results starting at cell A1 of the new worksheet. To name the new worksheet, type a name in the box.
New Workbook - Click to create a new workbook and paste the results on a new worksheet in the new workbook.
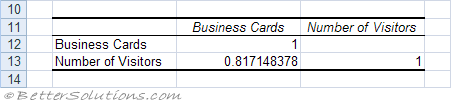
Press OK to generate the output.
The correlation coefficient between these two data sets is 0.845.
 |
Positive Correlation
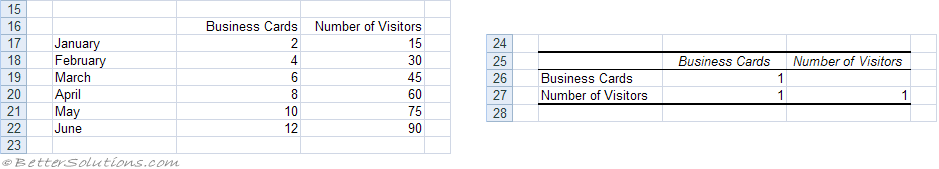
A coefficient of 1 denotes a perfect positive correlation.
(Very Strong = 1)
 |
Negative Correlation
A coefficient of -1 denotes a perfect negative correlation.
(Very Strong = -1)
 |
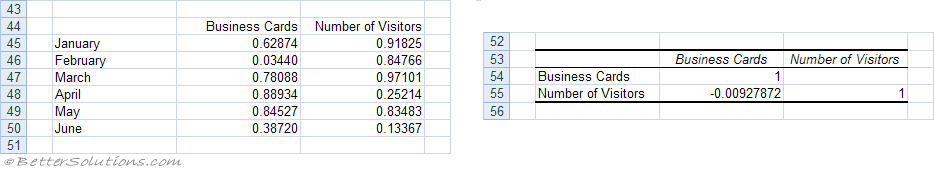
No Correlation
A coefficient of 0 means that there is no correlation.
 |
Multiple Variables
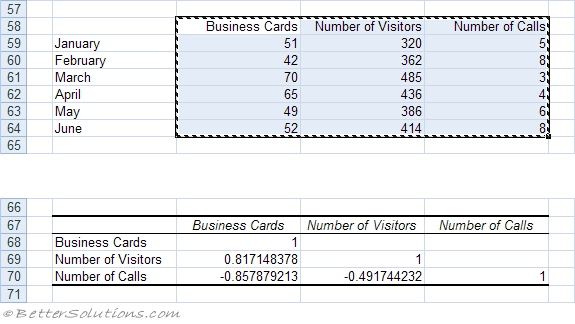
This feature can also be used to calculate correlations between multiple variables.
Lets image that we have a third variable called Number of Calls.
The table generated will display all the correlations between any two of the variables.
These pairs are called "pairwise correlations" and the table is called the "correlation matrix".
Remember that the row labels in column B are irrelevant and are not included in the input range.
 |
Important
The input range is not always populated with the current selection. The range is actually the last range that was used with this dialog box ??
The correlation coefficient can also be obtained using the CORREL worksheet function.
If your data is subject to change it may be easier to use the CORREL worksheet function.
If you want to compare multiple sets of values, you must create separate worksheet functions for each pair of values.
© 2026 Better Solutions Limited. All Rights Reserved. © 2026 Better Solutions Limited TopPrevNext