F-Test Two Sample
This compares the spread of two data sets by comparing their variances.
Remember that the Variance is a measure of how spread out, or scattered the values are.
Also sometimes known as the Fisher test.
The F-Test Two-Sample for Variances analysis tool performs a two-sample F-test to compare two population variances.
The F-test is also known as the Variance ratio.
This test involves calculating the variances for the two data sets, placing the larger value over the smaller value and then looking up the ratio in a table.
Using F-Test Two Sample for Variances
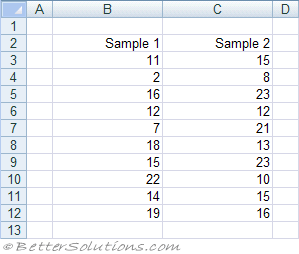
The F-Test is used to compare the variances of two samples.
Assumption that the largest mean is placed in the first column or row.
 |
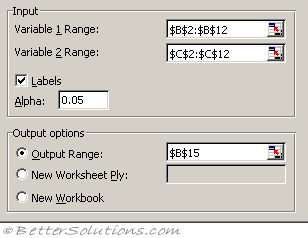 |
Variable 1 Range - Enter the reference for the first column or row of data you want to analyse.
Variable 2 Range - Enter the reference for the second column or row of data you want to analyse.
Labels - Select if the first row or column of your input range contains labels. Clear this check box if your input range has no labels; Microsoft Excel generates appropriate data labels for the output table.
Alpha - Enter the confidence level for the test. This value must be in the range 0...1. The alpha level is a significance level related to the probability of having a type I error (rejecting a true hypothesis).
Output Range - Enter the reference for the upper-left cell of the output table. Excel automatically determines the size of the output area and displays a message if the output table will replace existing data.
New Worksheet Ply - Click to insert a new worksheet in the current workbook and paste the results starting at cell A1 of the new worksheet. To name the new worksheet, type a name in the box.
New Workbook - Click to create a new workbook and paste the results on a new worksheet in the new workbook.
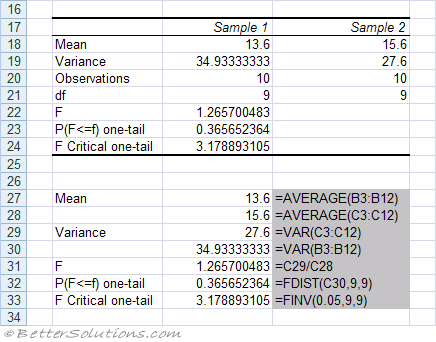 |
Mean - The mean of each of the samples.
Variance - The variance of each of the samples
Observations - The number of values in each of the samples.
df - The Degress of Freedom for each of the samples.
F - The F Statistic. An F statistic close to 1 provides evidence that the sample variances are equal. The higher the F statistic the less likely that the null hypothesis is true.
P(F<=f) one tail - The probability that the
F Critical one-tail - The critical value taken from the 0.05 F distribution.
Important
If the variances are equal then the F-Test will be 1.
© 2026 Better Solutions Limited. All Rights Reserved. © 2026 Better Solutions Limited TopPrevNext