Random Numbers
Excel has a RAND function and a RANDBETWEEN function.
These functions will only return numbers within a particular range
For more advanced random numbers you can use the Random Number Generation dialog box.
This gives you much greater control
number of variables - the number of columns
number of random numbers - how many values to return per column
random seed/selection - using this number in another session will return the same random number
Types of Distribution
| [[Uniform]] | High and Low values. Characterized by lower and upper bounds. Variables are drawn with equal probability from all values in the range. A common application uses a uniform distribution in the range 0...1. |
| [[Normal]] | Mean and standard deviation. Characterized by a mean and a standard deviation. A common application uses a mean of 0 and a standard deviation of 1 for the standard normal distribution. |
| [[Bernoulli]] | P value. Characterized by a probability of success (p value) on a given trial. Bernoulli random variables have the value 0 or 1. For example, you can draw a uniform random variable in the range 0...1. If the variable is less than or equal to the probability of success, the Bernoulli random variable is assigned the value 1; otherwise, it is assigned the value 0. |
| [[Binomial]] | P value and number of trials. Characterized by a probability of success (p value) for a number of trials. For example, you can generate number-of-trials Bernoulli random variables, the sum of which is a binomial random variable. |
| [[Poisson]] | Lambda Characterized by a value lambda, equal to 1/mean. Poisson distribution is often used to characterize the number of events that occur per unit of time for example, the average rate at which cars arrive at a toll plaza. |
| Patterned | Low, High, Step, No of repeats Characterized by a lower and upper bound, a step, repetition rate for values, and repetition rate for the sequence. |
| Discrete | Value and probability Characterized by a value and the associated probability range. The range must contain two columns: The left column contains values, and the right column contains probabilities associated with the value in that row. The sum of the probabilities must be 1. |
Using Random Number Generation
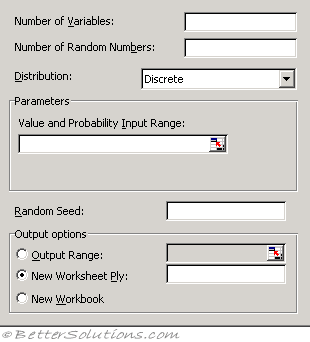 |
Number of Variables - Enter the number of columns of values you want in the output table. If you do not enter a number, Microsoft Excel fills all columns in the output range you specify.
Number of Random Numbers - Enter the number of data points you want to see. Each data point appears in a row of the output table. If you do not enter a number, Excel fills all rows in the output range you specify.
Distribution - Click the distribution method you want to use to create random values.
Parameters - Enter values to characterize the distribution selected.
Random Seed - Enter an optional value from which to generate random numbers. You can reuse this value later to produce the same random numbers.
Output Range - Enter the reference for the upper-left cell of the output table. Excel automatically determines the size of the output area and displays a message if the output table will replace existing data.
New Worksheet Ply - Click to insert a new worksheet in the current workbook and paste the results starting at cell A1 of the new worksheet. To name the new worksheet, type a name in the box.
New Workbook - Click to create a new workbook and paste the results on a new worksheet in the new workbook.
The Random Number Generation analysis tool fills a range with independent random numbers drawn from one of several distributions. You can characterise subjects in a population with a probability distribution.
For example, you might use a normal distribution to characterize the population of individuals' heights, or you might use a Bernoulli distribution of two possible outcomes to characterize the population of coin-flip results.
© 2026 Better Solutions Limited. All Rights Reserved. © 2026 Better Solutions Limited TopPrevNext