T-Test Two Sample
Equal Variances
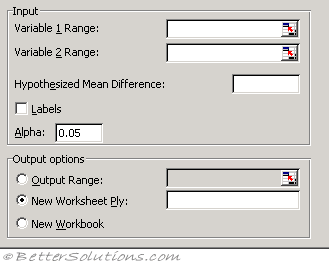 |
Variable 1 Range - Enter the cell reference for the first range of data you want to analyse. The range must consist of a single column or row of data.
Variable 2 Range - Enter the cell reference for the second range of data you want to analyse. The range must consist of a single column or row of data.
Hypothesized Mean Difference - Enter the number that you want for the shift in sample means. A value of 0 (zero) indicates that the sample means are hypothesized to be equal.
Labels - Select if the first row or column of your input ranges contains labels. Clear this check box if your input ranges have no labels; Microsoft Excel generates appropriate data labels for the output table.
Alpha - Enter the confidence level for the test. This value must be in the range 0...1. The alpha level is a significance level related to the probability of having a type I error (rejecting a true hypothesis).
Output Range - Enter the reference for the upper-left cell of the output table. Excel automatically determines the size of the output area and displays a message if the output table will replace existing data.
New Worksheet Ply - Click to insert a new worksheet in the current workbook and paste the results starting at cell A1 of the new worksheet. To name the new worksheet, type a name in the box.
New Workbook - Click to create a new workbook and paste the results on a new worksheet in the new workbook.
Unequal Variances
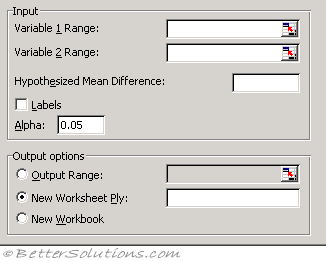 |
Variable 1 Range - Enter the cell reference for the first range of data you want to analyse. The range must consist of a single column or row of data.
Variable 2 Range - Enter the cell reference for the second range of data you want to analyse. The range must consist of a single column or row of data.
Hypothesized Mean Difference - Enter the number you want for the shift in sample means. A value of 0 (zero) indicates that the sample means are hypothesized to be equal.
Labels - Select if the first row or column of your input ranges contain labels. Clear this check box if your input ranges have no labels; Microsoft Excel generates appropriate data labels for the output table.
Alpha - Enter the confidence level for the test. This value must be in the range 0...1. The alpha level is a significance level related to the probability of having a type I error (rejecting a true hypothesis).
Output Range - Enter the reference for the upper-left cell of the output table. Excel automatically determines the size of the output area and displays a message if the output table will replace existing data.
New Worksheet Ply - Click to insert a new worksheet in the current workbook and paste the results starting at cell A1 of the new worksheet. To name the new worksheet, type a name in the box.
New Workbook - Click to create a new workbook and paste the results on a new worksheet in the new workbook.
t-Test: Two-Sample Assuming Unequal Variances This analysis tool performs a two-sample student's t-test. This t-test form assumes that the variances of both ranges of data are unequal; it is referred to as a heteroscedastic t-test. You can use a t-test to determine whether two sample means are equal. Use this test when the groups under study are distinct. Use a paired test when there is one group before and after a treatment.
© 2026 Better Solutions Limited. All Rights Reserved. © 2026 Better Solutions Limited TopPrevNext