Moving Average
Moving averages help identify trends in sequential data.
The data is period base, such as on a daily basis.
An average is calculated for a number of periods
Then the average is rolled through the data so the first average might be for days 1 to 7, then the next average is for days 2 to 8 etc.
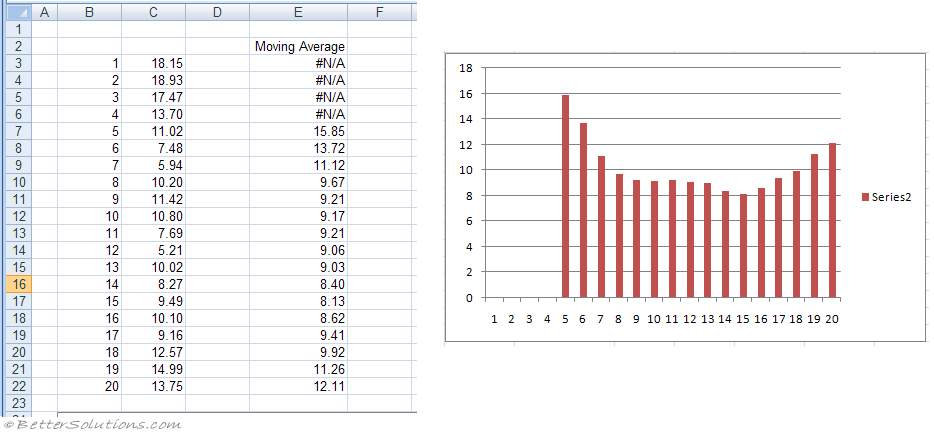
The Moving Average analysis tool projects values in the forecast period, based on the average value of the variable over a specific number of preceding periods.
A moving average provides trend information that a simple average of all historical data would mask. Use this tool to forecast sales, inventory, or other trends.
Each forecast value is based on the following formula.
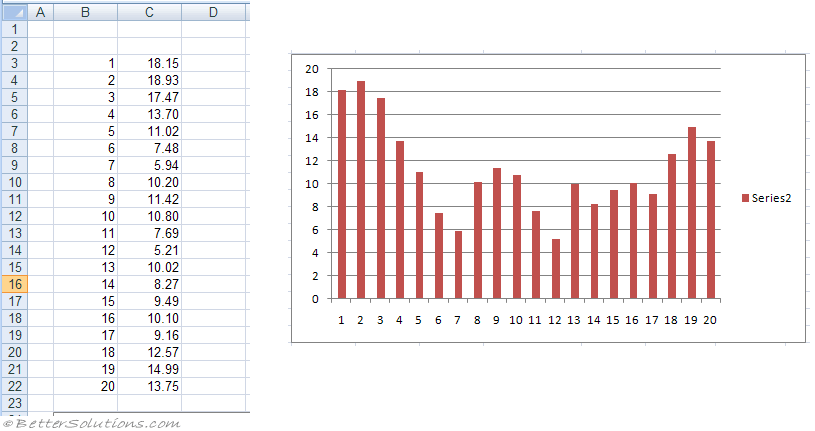
Moving averages are used to diminish the effects of spikes in data and to help identify trends
Viewing a plot of raw values can often seem random and chaotic
Viewing a moving average of the data can remove some of the volatility and try to help show a sense of direction.
Chart - one showing values
 |
Using Moving Average
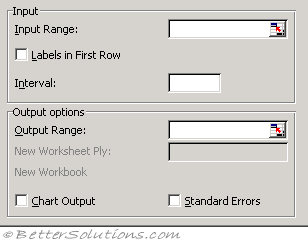 |
Input Range - Enter the cell reference for the range of data you want to analyse. The range must consist of a single column that contains four or more cells of data.
Labels in First Row - Select if the first row of your input range contains labels. Clear this check box if your input range has no labels; Microsoft Excel generates appropriate data labels for the output table.
Interval - Enter the number of values you want to include in the moving average. The default interval is 3.
Output Range - Enter the reference for the upper-left cell of the output table. If you select the Standard Errors check box, Excel generates a two-column output table with standard error values in the right column. If there are insufficient historical values to project a forecast or calculate a standard error, Excel returns the #N/A error value.
The output range must be on the same worksheet as the data used in the input range. For this reason, the New Worksheet Ply and New Workbook options are unavailable.
Chart Output - Select to generate an embedded histogram chart with the output table.
Standard Errors - Select if you want to include a column that contains standard error values in the output table. Clear if you want a single-column output table without standard error values.
 |
© 2026 Better Solutions Limited. All Rights Reserved. © 2026 Better Solutions Limited TopPrevNext