Insert Tab
Tables
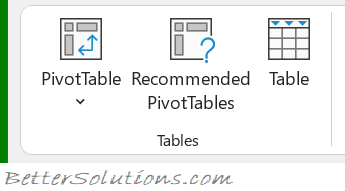 |
PivotTable - Button with Drop-Down. Displays the "PivotTable from table or range" dialog box. The drop-down contained the commands: PivotTable and PivotChart. The PivotTable displayed the "Create PivotTable" dialog box and the PivotChart displayed the "Create PivotTable and PivotChart" dialog box.
Recommended PivotTables - Displays the "Recommended PivotTables" dialog box. This shows a list of customised pivot tables that are best for your data. If there are no recommendations then a blank pivot table is created.
Table - (Ctrl + T). Displays the "Create Table" dialog box. When you define your data as a table it makes it easier to sort, filter and apply formatting.
Illustrations
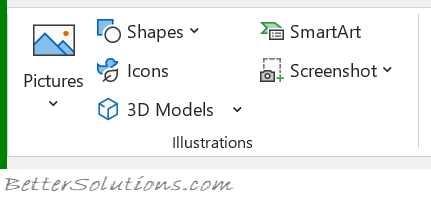 |
Pictures - (Changed in 365). Drop-Down. The drop-down contains the commands: This Device, Stock Images and Online Pictures. This Device displays the "Insert Picture" dialog box allowing you to browse to a file. Stock Images displays the Stock Image library dialog box. Online Pictures allows to you to browse images online.
Shapes - Drop-Down. The drop-down contains the commands: Recently Used Shapes, Lines, Rectangles, Basic Shapes, Block Arrows, Equation Shapes, Flowchart, Stars and Banners and Callouts.
Icons - Displays the "Insert Icons" dialog box. Insert an icon to visually communicate using symbols.
3D Models - Drop-Down. Insert a 3D model so you can rotate it and see it from all angles. The drop-down contains the commands: From a File and From Online Sources.
SmartArt - Displays the "Choose a SmartArt Graphic" dialog box which lets you choose from the following different types of smartart: List, Process, Cycle, Hierarchy, Relationship, Matrix, Pyramid, Picture and Office.com.
Screenshot - Drop-Down. The drop-down contains the commands: Available Windows and Screen Clipping. (Added in 2010).
Online Pictures - (Removed in 2021). Moved to the Pictures drop-down.
Controls
Added in 2024. This group was previously called "Cell Controls".
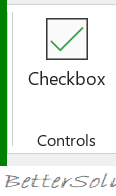 |
Checkbox - (Added in 365) Add a checkbox to a cell to display and edit True and False values.
Add-ins
This was moved to the Home tab in 2024.
Charts
You can quickly display the "Insert Chart" dialog box by selecting your data and clicking on the dialog box launcher in the bottom right corner of the group. If a chart is active the "Change Chart Type" dialog is displayed.
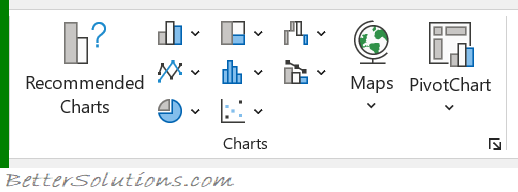 |
Recommended Charts - Displays the "Insert Chart" dialog box (Recommended Charts tab).
Column or Bar - Drop-Down. The drop-down contains the commands: 2-D Column, 3-D Column, 2-D Bar, 3-D Bar and More Column Charts.
Line or Area - Drop-Down. The drop-down contains the commands: 2-D Line, 3-D Line, 2-D Area, 3-D Area and More Line Charts.
Pie or Doughnut - Drop-Down. The drop-down contains the commands: 2-D Pie, 3-D Pie, Doughnut and More Pie Charts.
Hierarchy - Drop-Down. The drop-down contains the commands: Treemap, Sunburst and More Hierarchy Charts.
Statistic - Drop-Down. The drop-down contains the commands: Histogram, Box and Whisker and More Statistical Charts.
Scatter XY or Bubble - Drop-Down. The drop-down contains the commands: Scatter, Bubble and More Scatter Charts.
Waterfall, Funnel, Stock, Surface or Radar - This drop-down contains the commands: Waterfall, Funnel, Stock, Surface, Radar and More Stock Charts.
Combo - Drop-Down. Use a combo chart when the range of values in the chart varies widely or you have mixed types of data. The drop-down contains the commands: Clustered Column-Line, Clustered Column-Line (secondary axis), Stacked Area Clustered Column or Create Custom Combo Chart.
Maps - Drop-Down. The drop-down contains the commands: Filled Map and More Map Options.
PivotChart - Button with Drop-Down. The button displays the "Create PivotChart" dialog box. The drop-down contains the commands: PivotChart and PivotChart and PivotTable.
Tours
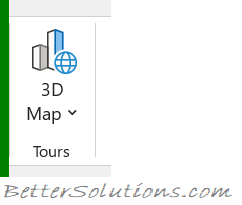 |
3D Map - Button with Drop-Down. The button displays the "Power Maps for Excel" window. The drop-down contans the commands: Launch Power Map and Add Selected Data to PowerMap. Allows you to create data visualisations in your workbooks. You must enable the Data Analysis add-ins to use this feature.
In Excel 2013 this functionality was made available by installing the Power Map add-in.
Reports
In Excel 2016 this group was removed.
In Excel 2013 this group is only displayed if you have the Power View add-in loaded.
Sparklines
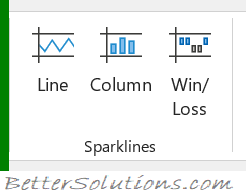 |
Line - Displays the "Create Sparklines" dialog box which lets you insert a line chart within a single cell.
Column - Displays the "Create Sparklines" dialog box which lets you insert a column chart within a single cell.
Win/Loss - Displays the "Create Sparklines" dialog box which lets you insert a win/loss chart within a single cell.
Filters
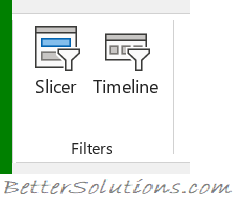 |
Slicer - Filter dates in your Tables. Exactly the same command can be found on the Table Tools - Design Tab.
Timeline - Filter dates in your tables, pivot tables and pivot charts.
Links
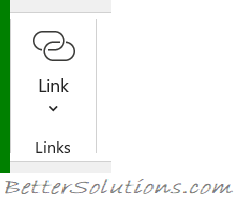 |
Link - Button with Drop-Down. (Ctrl + K). Displays the "Insert Hyperlink" dialog box. The drop-down contains a list of recent items. Previously called Hyperlink.
Comments
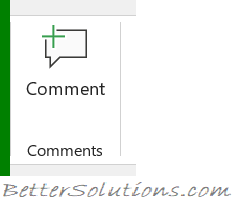 |
Comment - Insert a note into the active cell.
Text
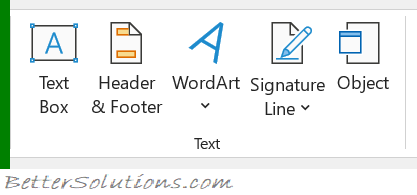 |
Text Box - Inserts a textbox that can be positioned anywhere on the page.
Header & Footer - Switches to Page Layout view and automatically puts your cursor in the header box. This will then display the "Header & Footer Tools - Design" contextual tab. To exit just click out of the header or footer.
WordArt - Drop-Down. Gives you a choice of Word Art styles to insert. The drop-down contains a gallery of different styles.
Signature Line - Button with Drop-Down. The button inserts a signature line that specifies the individual who must sign. The drop-down displays the commands: Microsoft Office Signature Line and Add Signature Services.
Object - Displays the "Object" dialog box allowing you to insert embedded objects.
Symbols
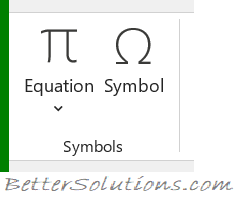 |
Equation - Drop-Down. The drop-down contains the commands: Area of Circle, Binomial Theorem, Expansion of a Sum, Fourier Series and Insert New Equation.
Symbol - Displays the "Symbol" dialog box.
© 2026 Better Solutions Limited. All Rights Reserved. © 2026 Better Solutions Limited TopPrevNext