Data Tab
Get & Transform Data
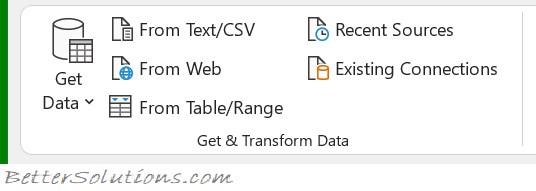 |
Get Data - Drop-Down. Discover, connect and combine data from multiple sources. The drop-down includes the commands: From File, From Database, From Azure, From Online Services (New), From Other Sources, Combine Queries, Launch Query Editor (New), Data Source Settings and Query Options. more
From Text/CSV - Import data from a text, comma-separated value or formatted text (space delimited) file.
From Web - Import data from a web page.
From Table/Range - Create a new query linked to the selected table. If the selected range is not part of a table, it will be converted into a table.
From Picture - (Added in 365). Drop-Down. Convert images that have table data into data that you can edit in Excel. The drop-down includes the commands: Picture From File and Picture From Clipboard. more
Recent Sources - Manage and connect to recent sources.
Existing Connections - Import data from common sources.
Queries & Connections
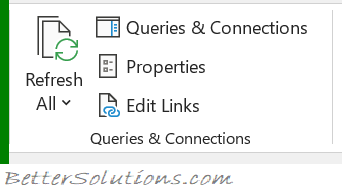 |
Refresh All - (Ctrl + Alt + F5). Button with Drop-Down. The button updates all the information in the active workbook coming in from external sources. The drop down includes the commands: Refresh, Refresh Status, Cancel Refresh and Connection Properties.
Queries & Connections - Displays the "Workbook Connections" dialog box. Data connections are links to data sources outside of this workbook.
Properties - This is only enabled when you select a cell that has been populated using an external connection.
Edit Links - Displays the "Edit Links" dialog box.
Data Types
These are called Linked Data Types because they have a connection to an online data source that allows you to refresh the information.
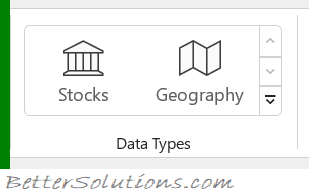 |
Stocks - (Added in 365). Converts the selected cells into a Stocks data type to easily retrieve financial information such as tickers, prices and other general company information. more
Currencies - (Added in 365). Converts cells with currency pairs separated by "/" or ":" such as "USD/EUR" into a Currency data type to get currency conversion rates.
Geography - (Added in 365). Converts the selected cells into a Geography data type to easily retrieve information on countries, regions, cities and populations. more
Sort & Filter
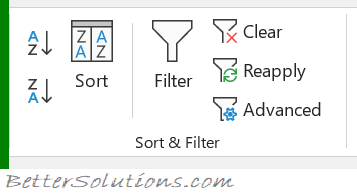 |
Sort A to Z - Sorts data alphabetically from A-Z and numerically from the lowest number to the highest.
Sort Z to A - Sorts data alphabetically from Z-A and numerically from the highest number to the lowest.
Sort - Displays the "Sort" dialog box.
Filter - Toggles filtering on the current selection.
Clear - Clears the filter and sort for the current selection.
Reapply - (Ctrl + Alt + L). Reapplies the filter and sort to the current selection.
Advanced - Displays the "Advanced Filter" dialog box. more
Data Tools
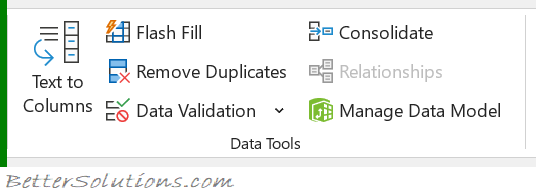 |
Text to Columns - Displays the "Convert Text to Columns Wizard" dialog box.
Flash Fill - Automatically fills in values. more
Remove Duplicates - Displays the "Remove Duplicates" dialog box. more
Data Validation - Button with Drop-Down. The button displays the "Data Validation" dialog box. The drop-down includes the commands: Circle Invalid Data and Clear Validation Circles. more
Consolidate - Displays the "Consolidate" dialog box. more
Relationships - Allows you to create or edit relationships between tables to show related data from different tables on the same report.
Manage Data Model - Opens the Power Pivot window. You must enable the Data Analysis add-ins to enable this feature. more
Forecast
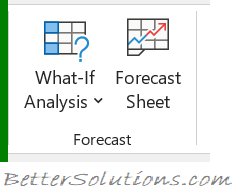 |
What-If Analysis - Drop-Down. The drop-down contains the commands: Scenario Manager, Goal Seek and Data Table.
Forecast Sheet - Displays the "Create Forecast Worksheet" dialog box that lets you forecast your timeline data. more
Outline
You can quickly display the "Settings" dialog box, by clicking on the dialog box launcher in the bottom right corner of this group.
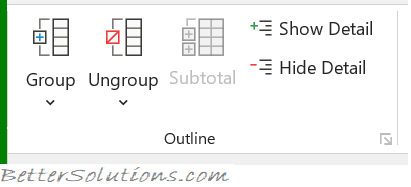 |
Group - Button with Drop-Down. The button lets you group a selection of rows and columns. The drop-down also contains the commands: Group and Auto Outline. The Auto Outline command creates an automatic outline from the current region.
Ungroup - Button with Drop-Down. The button lets you remove the outlines from the current rows and columns. The drop-down contains the commands: Ungroup and Clear Outline. The Clear Outline command clears all the levels of outline.
Subtotal - Automatically insert subtotals for the selected rows.
Show Detail - Expand a collapsed group of cells.
Hide Detail - Collapse a group of cells.
Analysis
This group will be only be displayed if you have either the Analysis-ToolPak add-in or the Solver add-in loaded.
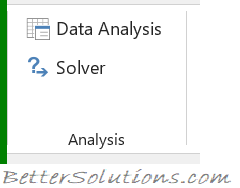 |
Data Analysis - This is only displayed if you have the Analysis-ToolPak add-in loaded. Displays the "Data Analysis" dialog box.
Solver - This is only displayed if you have the Solver add-in loaded. Displays the "Solver Parameters" dialog box.
© 2026 Better Solutions Limited. All Rights Reserved. © 2026 Better Solutions Limited TopPrevNext